
Fig. 1
- ID
- ZDB-FIG-220617-52
- Publication
- Hall et al., 2022 - A New Transgenic Line for Rapid and Complete Neutrophil Ablation
- Other Figures
- All Figure Page
- Back to All Figure Page
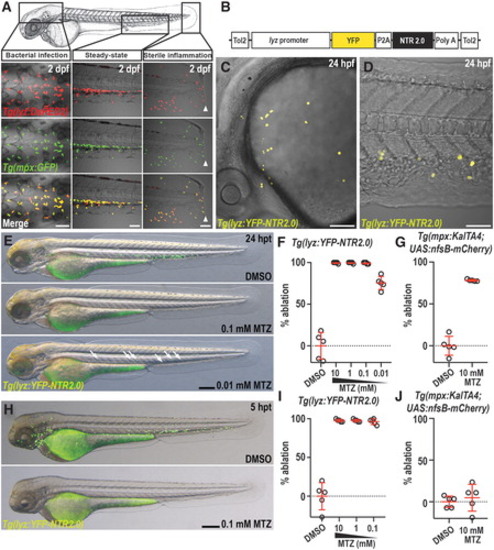
FIG. 1. Low-dose MTZ treatment of Tg(lyz:YFP-NTR2.0) larvae results in fast and effective neutrophil ablation. (A) Overlapping expression of lyz:DsRED2 and mpx:GFP transgenes within neutrophils of 2 dpf Tg(lyz:DsRED2) and Tg(mpx:GFP) larval zebrafish, within the hindbrain 3 h after injection of Salmonella Typhimurium (left panels), within the tail under noninflammatory (steady-state) conditions (middle panels) and the fin 3 h after fin amputation (sterile inflammation, right panels). White arrowheads mark tail fin transection plane. (B) Schematic illustrating the lyz:YFP-NTR2.0 transgene construct. (C, D) Live imaging of YFP-NTR2.0-expressing neutrophils on the yolk surface (C) and posterior blood island (D) of 24 hpf Tg(lyz:YFP-NTR2.0) embryos. (E) Live imaging of 3 dpf Tg(lyz:YFP-NTR2.0) larvae, 24 hpt with 0.1 mM and 0.01 mM MTZ, compared with DMSO control (white arrows mark remaining neutrophils in 0.01 mM MTZ-treated larva). (F) Flow cytometry quantification of neutrophil ablation within 3 dpf Tg(lyz:YFP-NTR2.0) larvae, 24 hpt with 10, 1, 0.1, and 0.01 mM MTZ or DMSO (% ablation = 100 – [100 × %YFP+ cells normalized to DMSO control mean]). (G) Flow cytometry quantification of neutrophil ablation within 3 dpf Tg(mpx:KalTA4;UAS:nfsB-mCherry) larvae, 24 hpt with 10 mM MTZ or DMSO (% ablation = 100 – [100 × %mCherry+ cells normalized to DMSO control mean]). (H) Live imaging of 53 hpf Tg(lyz:YFP-NTR2.0) larvae, 5 hpt with 0.1 mM MTZ, compared with DMSO control. (I) Flow cytometry quantification of neutrophil ablation within 53 hpf Tg(lyz:YFP-NTR2.0) larvae, 5 hpt with 10, 1, and 0.1 mM MTZ or DMSO. (J) Flow cytometry quantification of neutrophil ablation within 53 hpf Tg(mpx:KalTA4;UAS:nfsB-mCherry) larvae, 5 hpt with 10 mM MTZ or DMSO. For flow cytometry quantification of whole larvae neutrophil abundance, n = 5 samples/treatment with ∼30 larvae/sample. Error bars represent the mean ± SD. Scale bars: 75 μm in (A, D), 150 μm in (C), 300 μm in (E, H). DMSO, dimethyl sulfoxide; dpf, days postfertilization; hpt, hours post-treatment; MTZ, metronidazole; NTR, nitroreductase; SD, standard deviation; YFP, yellow fluorescent protein. |