
FIGURE
Fig. 2
- ID
- ZDB-FIG-220615-42
- Publication
- Cosacak et al., 2022 - Single Cell/Nucleus Transcriptomics Comparison in Zebrafish and Humans Reveals Common and Distinct Molecular Responses to Alzheimer's Disease
- Other Figures
- All Figure Page
- Back to All Figure Page
Fig. 2
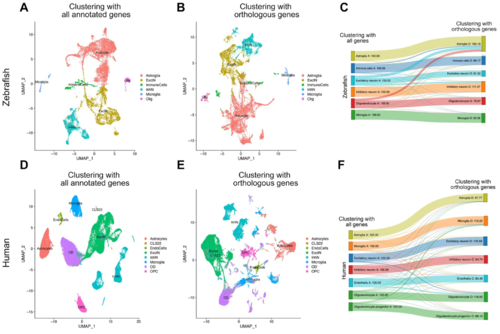
Figure 2. Transition analysis between cell clusters. (A) tSNE plot showing the main cell types in zebrafish when all genes annotated in zebrafish are used for clustering. (B) tSNE plot showing the main cell types in zebrafish when only the genes orthologous to humans are used for clustering. (C) Transition diagram between (A,B). When human orthologous genes are used, majority of the cell types remain in their clusters, with slight exception of a subset of oligodendrocytes, excitatory neurons, and inhibitory neurons that start clustering in astroglia. (D) tSNE plot showing the main cell types in humans when all genes annotated in humans are used for clustering. (E) tSNE plot showing the main cell types in humans when only the genes orthologous to zebrafish are used for clustering. (F) Transition diagram between (D,E). When zebrafish orthologous genes are used, the vast majority of the cell types remain in their clusters.
|
Expression Data
Expression Detail
Antibody Labeling
Phenotype Data
Phenotype Detail
Acknowledgments
This image is the copyrighted work of the attributed author or publisher, and
ZFIN has permission only to display this image to its users.
Additional permissions should be obtained from the applicable author or publisher of the image.
Full text @ Cells