
FIGURE
Fig. 5
Fig. 5
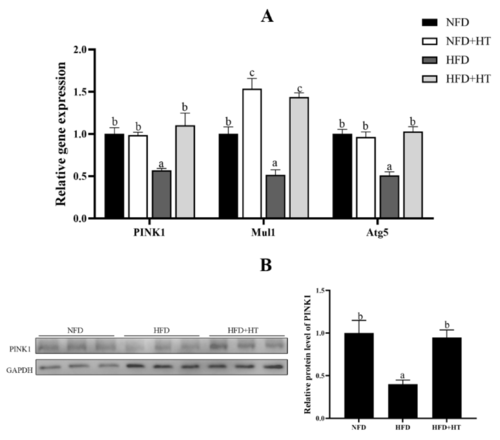
Figure 5. Relative gene expression of mitophagy-related genes (A) and protein level of PINK1 (B) in the liver of L. maculatus fed the test diets for 8 weeks. All values are exhibited as mean ± SE. The values with different superscripts (a, b, c) are significantly different at p < 0.05 (Tukey’s test).
|
Expression Data
Expression Detail
Antibody Labeling
Phenotype Data
Phenotype Detail
Acknowledgments
This image is the copyrighted work of the attributed author or publisher, and
ZFIN has permission only to display this image to its users.
Additional permissions should be obtained from the applicable author or publisher of the image.
Full text @ Antioxidants (Basel)