
Fig. 3
- ID
- ZDB-FIG-220601-17
- Publication
- Evans et al., 2022 - Glucose uptake as an alternative to oxygen uptake for assessing metabolic rate in Danio rerio larvae
- Other Figures
- All Figure Page
- Back to All Figure Page
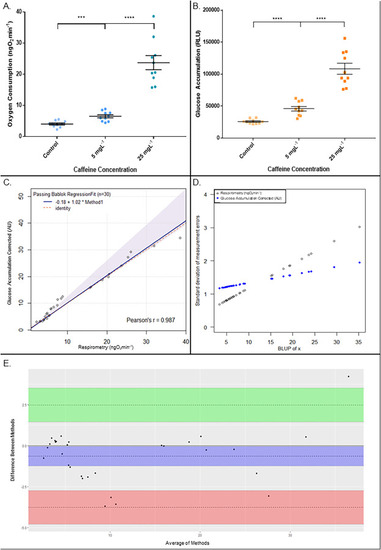
Figure 3. Comparison of metabolic rate as measured by stop-flow respirometry (3a) and glucose uptake (3b), Passing-Bablok comparison of the two methods (3c) with associated precision plot (3d) and Bland-Altman residuals plot (3e). 96 hpf zebrafish larvae were incubated in one of three caffeine concentrations (0 mg L-1, 5 mg L-1, and 25 mg L-1) to generate groups with differing metabolic rates. 3a. Oxygen uptake was measured by stop-flow respirometry in nanograms of oxygen per minute per larvae (n = 10). There was a significant increase in oxygen consumption between control and caffeine treated zebrafish larvae, with oxygen uptake increasing with increasing concentrations of caffeine (*** = 0.0006. **** <0.0001). 3b. The rate of cellular glucose accumulation was measured using a Glucose-Uptake GloTM Assay. There was a significant increase in luminescence between control and caffeine treated zebrafish larvae, with higher levels of luminescence correlating with higher concentrations of caffeine (**** <0.0001). All data are represented as individual data points with mean and SEM bars. Significance was determined by one-way ANOVA. 3c. Passing-Bablok Regression of respirometry versus scaled glucose uptake assay data, including regression line, identity line, and 95% confidence limits (grey shaded area). y = 1.02x −0.18, 95% confidence intervals −1.018 ≤ α ≤ 0.89 and 0.97 ≤ β ≤ 1.33. 3d. Precision plot comparing the two methods over the given range. Respirometry is marginally more precise at lower metabolic rates, while the Glucose Uptake Assay became increasingly more precise compared to respirometry as metabolic rate increased. 3e. Bland-Altman plot of the residuals. Bias = −0.64 (purple). Upper limit of agreement = 2.48 (green), lower limit of agreement = −3.77 (pink). Upper 95% confidence interval = 3.51, lower 95% confidence interval = −4.79. |