
Fig. 7
- ID
- ZDB-FIG-220527-13
- Publication
- Kugler et al., 2022 - Analytical Approaches for the Segmentation of the Zebrafish Brain Vasculature
- Other Figures
- All Figure Page
- Back to All Figure Page
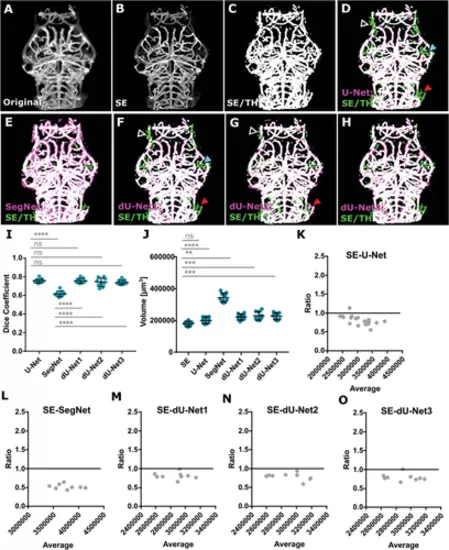
Deep learning results when trained from original data. (A) Original image, (B) enhanced, and (C) segmented using Otsu thresholding (referred to as SE/TH). (D) MIP of SE/TH (green) and original U-Net (magenta) segmentation, showing high degrees of overlap (white), whereas certain vessels were extracted with SE but not U-Net (arrowheads). (E) MIP of SE/TH (green) and SegNet (magenta) segmentation, showing consistent oversegmentation with SegNet. (F) MIP of SE/TH (green) and dU-Net1 (magenta) segmentation, showing high degrees of overlap (white), whereas certain vessels were extracted with SE/TH but not dU-Net1 (arrowheads). (G) MIP of SE/TH (green) and dU-Net2 (magenta) segmentation. (H) MIP of SE/TH (green) and dU-Net3 (magenta) segmentation. (I) Dice coefficient of segmentation outcomes (n = 9; 3 dpf). (J) Quantified vascular volumes. (K-O) Bland-Altman ratio test comparing vascular volume values. |