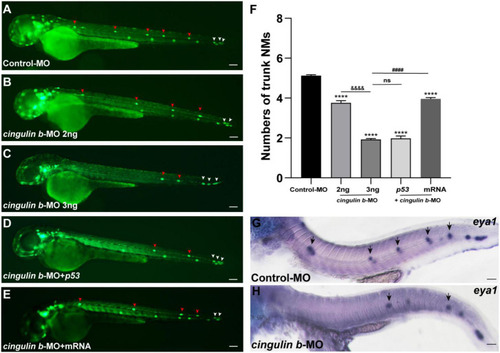
Inhibition of cingulin b affects the normal deposition of neuromasts in zebrafish. (A–E) In transgenic cldnb:lynGFP embryos, the neuromasts of PLL are labeled with green fluorescence. At 48 hpf, the deposition of neuromasts in zebrafish is shown in the control group (A), cingulin b knockdown group (B,C), cingulin b-MO + p53 group (D), and cingulin b-MO + cingulin b mRNA group (E), respectively. (F) The number of PLL neuromasts in controls (n = 235), cingulin b knockdown (2 ng or 3 ng) group (n = 86 and 264, respectively), cingulin b-MO (3 ng) + p53 group (n = 81), and cingulin b-MO (3 ng) + mRNA embryos (n = 180) at 48 hpf. The number of neuromasts decreased dose-dependently after knockdown of cingulin b(A–C,F). The decrease in the number of neuromasts is also confirmed when co-injecting with cingulin b-MO and p53(C,D,F). Combined injection of cingulin b-MO and cingulin b mRNA can partially rescue the decrease in the number of neuromasts caused by cingulin b-MO (E,F). Red arrowheads mark the neuromasts in the trunk, and white arrowheads mark the terminal neuromasts of the PLL system (A–E). Scale bars represent 100 μm. Data are shown in mean ± SEM. *Stands by the comparison with the control group: ***p < 0.0001. #Stands by the comparison between cingulin b-MO group and cingulin b-MO + cingulin b mRNA group: ####p < 0.0001. &Stands by the comparison between 2 ng cingulin b-MO group and 3 ng cingulin b-MO group: &&&&p < 0.0001. ns means no significance. (G,H) The number of eya1 labeled neuromasts is markedly reduced after knocking down of cingulin b(G)n = 21 compared to the Control-MOs (H)n = 14. The black arrows in G and H indicate the neuromasts. Scale bars in panel (G,H) mark 50 μm.
|
