
FIGURE
Fig. 4
- ID
- ZDB-FIG-220520-56
- Publication
- Alba-González et al., 2022 - Distribution of Neurogranin-like immunoreactivity in the brain and sensory organs of the adult Zebrafish
- Other Figures
- All Figure Page
- Back to All Figure Page
Fig. 4
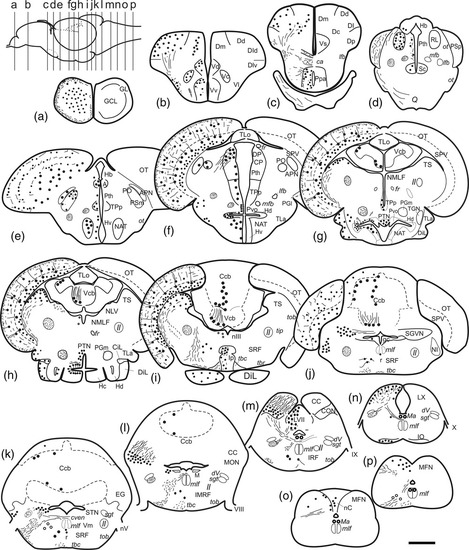
(a–p) Schematic drawings of transverse sections of the zebrafish brain from rostral (a) to caudal (p) showing on the left the Nrgn-like-ir cell bodies (big dots), neuronal processes and tracts (thin lines and small dots), while on the right the annotations of different nuclei and tracts. The levels of the sections are indicated by lines in the lateral diagram of the brain on the left. For abbreviations, see the list. Scale bar for sections: 200 μm (a–p)
|
Expression Data
| Antibody: | |
|---|---|
| Fish: | |
| Anatomical Terms: | |
| Stage: | Adult |
Expression Detail
Antibody Labeling
Phenotype Data
Phenotype Detail
Acknowledgments
This image is the copyrighted work of the attributed author or publisher, and
ZFIN has permission only to display this image to its users.
Additional permissions should be obtained from the applicable author or publisher of the image.
Full text @ J. Comp. Neurol.