
Fig. 2
- ID
- ZDB-FIG-220519-28
- Publication
- Sojan et al., 2022 - Zebrafish caudal fin as a model to investigate the role of probiotics in bone regeneration
- Other Figures
- All Figure Page
- Back to All Figure Page
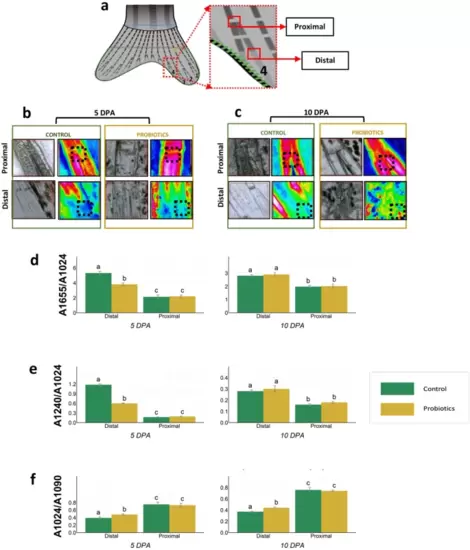
Representative picture showing the areas analyzed by FTIRI in the fourth bifurcated fin ray of the dorsal lobe of the regenerating fin. The two regions assayed after amputation were: proximal-corresponding to the first formed bifurcation after amputation and distal-corresponding to the last segment joint preceding the actinotrichia; (b and c) Representative microphotograph (left) and false color images (right) denoting the topographical distribution of phosphate groups in the proximal and distal areas of the regenerated fin from C and P fins (n = 3) at (b) 5 DPA and (c) 10 DPA time points. The same color scale (0–3) was used for all false color images: white/light pink colors indicate the areas with the highest amount of phosphates, red/orange/yellow indicate the areas with an intermediate amount and black/dark blue shows the areas with the lowest amount of phosphates. The black dotted squares indicate the region where spectra were extracted for the curve fitting analysis; (d–f) Biochemical composition and bone mineralization assessed by FTIRI analysis. Histograms representing band area ratios (d) A1655/A1024, (e) A1240/A1024 and (f) A1024/A1090 are calculated on proximal and distal regions of the regenerating fin from C (n = 3) and P (n = 3) fins at 5 DPA and 10 DPA. Data are presented as mean ± S.D. Different letters over the histograms indicate statistically significant difference among groups. Two-way ANOVA and Tukey’s multiple comparison test are used, and statistical significance was set at p < 0.05. |