
FIGURE
Figure 3
- ID
- ZDB-FIG-220518-3
- Publication
- Sojan et al., 2022 - Zebrafish as a Model to Unveil the Pro-Osteogenic Effects of Boron-Vitamin D3 Synergism
- Other Figures
- All Figure Page
- Back to All Figure Page
Figure 3
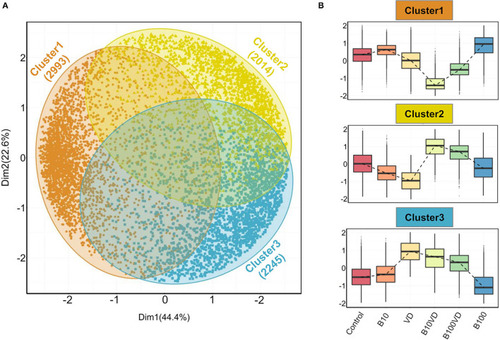
Outputs from PAM clustering of all the DEGs. |
Expression Data
Expression Detail
Antibody Labeling
Phenotype Data
Phenotype Detail
Acknowledgments
This image is the copyrighted work of the attributed author or publisher, and
ZFIN has permission only to display this image to its users.
Additional permissions should be obtained from the applicable author or publisher of the image.
Full text @ Front Nutr