
FIGURE 3
- ID
- ZDB-FIG-220515-10
- Publication
- Gegner et al., 2022 - Deep Metabolic Profiling Assessment of Tissue Extraction Protocols for Three Model Organisms
- Other Figures
- All Figure Page
- Back to All Figure Page
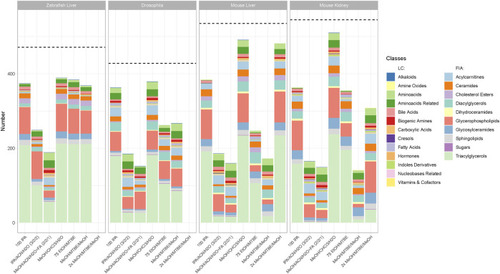
Number of metabolites per class with the highest concentration per extraction protocol across all sample types and model organisms. Metabolites that appear in the bar chart are only counted when they produce the highest or a non-significantly lower concentration ( |