
FIGURE
Fig. 3
- ID
- ZDB-FIG-220506-1
- Publication
- Di et al., 2021 - Enantioselective toxicity and mechanism of chiral fungicide penflufen based on experiments and computational chemistry
- Other Figures
- All Figure Page
- Back to All Figure Page
Fig. 3
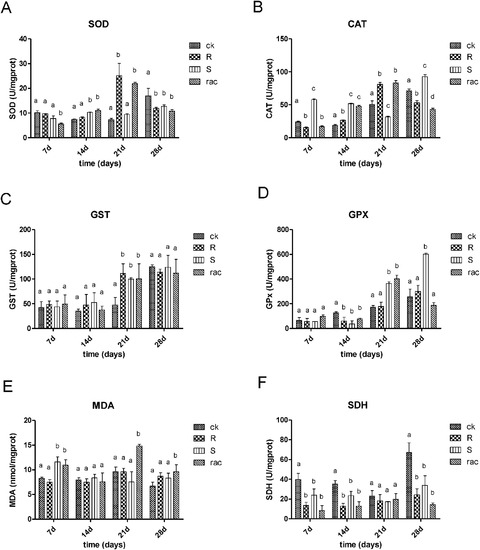
Fig. 3. The activity changes of SOD (A), CAT (B), GST (C), GPX (D) and SDH (F), and the content changes of MDA (E) in the livers of D. rerio (triplicate for each treatment). Bars are standard deviation. Different letters indicate significant difference among different treatments at the same time point (p < 0.05). ck, R, S and rac represents control, R-(-)-penflufen, S-(+)-penflufen and rac-penflufen treatments, respectively. |
Expression Data
Expression Detail
Antibody Labeling
Phenotype Data
Phenotype Detail
Acknowledgments
This image is the copyrighted work of the attributed author or publisher, and
ZFIN has permission only to display this image to its users.
Additional permissions should be obtained from the applicable author or publisher of the image.
Full text @ Ecotoxicol. Environ. Saf.