
Fig. 3
- ID
- ZDB-FIG-220504-25
- Publication
- Yang et al., 2021 - Variations of enzymatic activity and gene expression in zebrafish (Danio rerio) embryos co-exposed to zearalenone and fumonisin B1
- Other Figures
- All Figure Page
- Back to All Figure Page
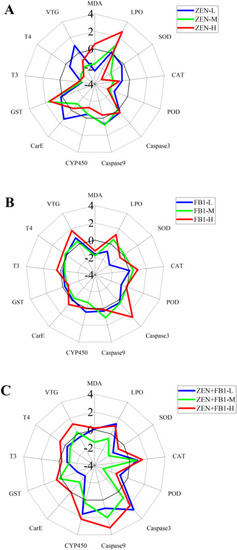
Integrated biomarker response index of all indicators for zebrafish embryos after exposure to ZEN (A), FB1 (B) and their combinations (C). The length from original point of the star plot to the crossover point of the different color circle and the coordinate axis represents standardized value of each index at different concentration. The black circle is a base line. ZEN = zearalenone; FB1 = fumonisin B1; L = low concentration; M = middle concentration; H = high concentration. (For interpretation of the references to colour in this figure legend, the reader is referred to the web version of this article.) |