
FIGURE
Figure 4
- ID
- ZDB-FIG-220430-77
- Publication
- Niedbalska-Tarnowska et al., 2022 - Assessment of the Preventive Effect of L-carnitine on Post-statin Muscle Damage in a Zebrafish Model
- Other Figures
- All Figure Page
- Back to All Figure Page
Figure 4
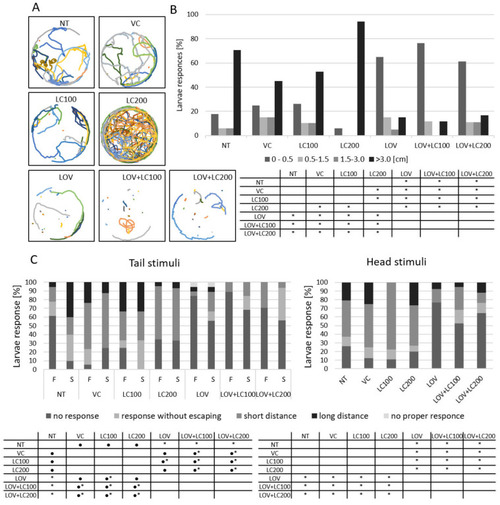
Figure 4. Swimming behaviour of 120 hpf zebrafish larvae exposed to lovastatin (LOV) and L-carnitine (LOV+LC200) treatment. (A) Spontaneous displacement of zebrafish larvae in control (non-treated, NT; vehicle control, VC; 100 μM L-carnitine, LC100; 200 μM L-carnitine, LC200) and experimental (0.5 μM lovastatin, LOV; 0.5 μM lovastatin and 100 μM L-carnitine, LOV+LC100; 0.5 μM lovastatin and 200 μM L-carnitine LOV+LC200) groups. Graphs show larvae displacement over the 10 min period. (B) Bar graph demonstrates the percentage of zebrafish larvae in seven investigated groups in 4 ranges of the distance travelled: no movement (up to 0.5), from 0.5 to 1.5, from 1.5 to 3, and more than 3 cm. The table below indicates the pairwise comparison between responses of seven investigated groups. Statistically significant differences are indicated with *; * p < 0.05 (Kruskal–Wallis test followed by the Pairwise Mann–Whitney post-hoc test). The experiment was repeated at least 3 times (with 18 to 20 individuals in each investigated group). (C) Touch-evoked response assay. Stacked column graphs demonstrate the number of zebrafish larvae as a function of their response to first (F) and second (S) tail touch stimulation, as well as in response to a head touch. Depending on the type of reaction, zebrafish larvae were divided into 4 groups: no response, response without escaping (defined as a lateral undulation of the tail immediately after being touched), short distance (larvae travelled a distance of no more than 20 mm), long distance (larvae travelled more than 20 mm). The tables below indicate the pairwise comparison between responses of seven investigated groups. Statistically significant differences are indicated with *; * p < 0.05 (Kruskal–Wallis test followed by the pairwise Mann–Whitney post-hoc test). The experiment was repeated at least 3 times (with 18 to 20 individuals in each investigated group).
|
Expression Data
Expression Detail
Antibody Labeling
Phenotype Data
Phenotype Detail
Acknowledgments
This image is the copyrighted work of the attributed author or publisher, and
ZFIN has permission only to display this image to its users.
Additional permissions should be obtained from the applicable author or publisher of the image.
Full text @ Cells