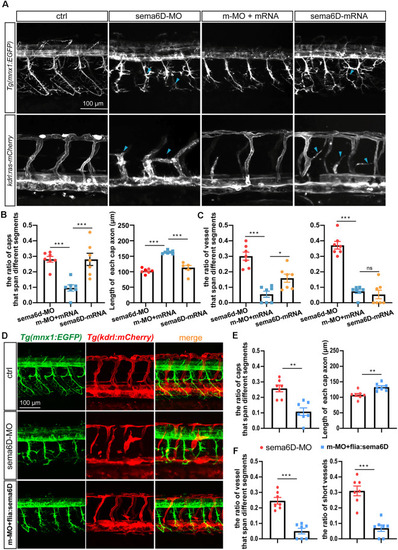
Overexpressing sema6D partially restored the defects of PMNs and ISVs in sema6D-deficient embryos. (A) Confocal imaging analysis of PMNs and ISVs in control, sema6D-MO, and sema6D-mRNA injected embryos at 48 hpf. Blue arrowheads indicate aberrant PMNs and ISVs. (B) The statistical analysis of the ratio of aberrant axonal projection of Caps (P = 0.0006) and short Caps (P = 0.0006) in sema6D-MO, m-MO+sema6D-mRNA, and sema6D-mRNA injected embryos at 48 hpf (n = 7). About 9–11 caps were used for statistics per zebrafish. Mann-Whitney test. Values with *** above the bars are significantly different (P < 0.001). (C) The statistical analysis of the ratio of vessel that span different segments (***P = 0.0006; *P = 0.0291) and the ratio of ectopic vessels (P = 0.0006) in the sema6D-MO, m-MO+sema6D-mRNA, and sema6D-mRNA injected embryos at 48 hpf (n = 7). About 9–12 ISVs were used for statistics per zebrafish. Mann-Whitney test. Values with *** above the bars are significantly different (P < 0.001). Value with “ns” above the bars indicated no significantly different. (D) Confocal imaging analysis of PMNs and ISVs in control, sema6D morphants, and sema6D morphants with fli1a:sema6D plasmid at 48 hpf. (E) The statistical analysis of the ratio of aberrant axonal projection of Caps (P = 0.0012) and the length of Caps (P = 0.0047) in the sema6D morphants and sema6D morphants with fli1a:sema6D plasmid at 48 hpf (n = 7). About 9–11 caps were used for statistics per zebrafish. Mann-Whitney test. Values with ** above the bars are significantly different (P < 0.01). (F) The statistical analysis of the ratio of vessels that span different segments (P = 0.0006) and the ratio of ectopic vessels (P = 0.0006) in the sema6D morphants and sema6D morphants with fli1a:sema6D plasmid at 48 hpf (n = 7). About 9–12 ISVs were used for statistics per zebrafish. Mann-Whitney test. Values with *** above the bars are significantly different (P < 0.001).
|
