
Fig. 3.
- ID
- ZDB-FIG-220422-25
- Publication
- Rutherford et al., 2022 - A zebrafish reporter line reveals immune and neuronal expression of endogenous retrovirus
- Other Figures
- All Figure Page
- Back to All Figure Page
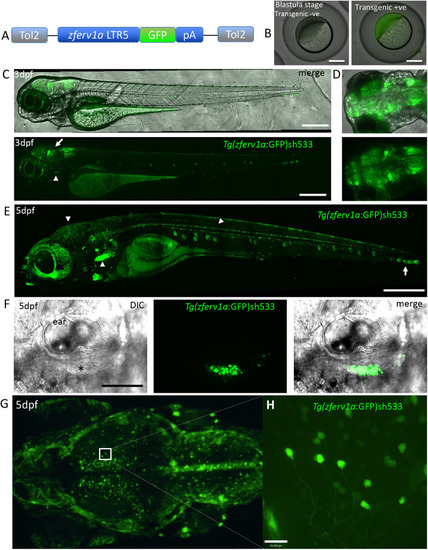
Reporter line for zferv1a recapitulates endogenous expression. (A) Diagram of the Gateway construct used to create the Tg(zferv1a:GFP) reporter line using the pDestCryCFP Tol2 backbone. (B) Representative images of non-transgenic and Tg(zferv1a:GFP:pA)sh533 transgenic embryos at the blastula stage. (C) Lateral view of DIC and GFP high-resolution images of a 3 dpf Tg(zferv1a:GFP:pA)sh533 embryo, displaying high expression of the transgene in the brain (white arrow) and the start of a signal in the thymus (white arrowheads). Scale bars: 400 µm. (D) Dorsal view of the brain at 3 dpf, showing GFP expression alone or merged with brightfield image. (E) High-resolution image of a 5 dpf Tg(zferv1a:GFP:pA)sh533 embryo, displaying high expression of the transgene in the thymus, brain and spinal cord (white arrowheads). Note the signal in neuromasts alongside the trunk (white arrow). Scale bar: 500 µm. (F) Single-slice DIC and confocal GFP fluorescence merged image of the thymus (black asterisk) situated underneath the ear in 5 dpf embryos and the signal from the Tg(zferv1a:GFP)sh533 reporter. Scale bar: 100 µm. (G) Dorsal view of a maximum projection of the brain from a 5 dpf Tg(zferv1a:GFP) embryo acquired with a lightsheet microscope. (H) High-resolution single-slice image from the optic tectum of the same Tg(zferv1a:GFP) embryo. Scale bar: 15 µm. |