|
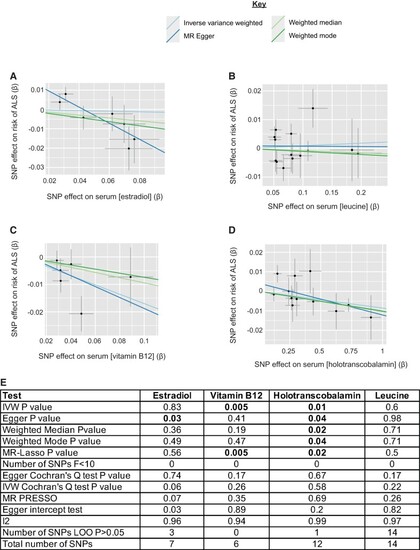
MR analysis of additional members of metabolic pathways containing metabolites identified in an unbiased screen. (A–D) Scatter plots demonstrating the correlation between genetic liability to serum estradiol (MR Egger P = 0.03, beta = −0.42, se = 0.14) (A), leucine (IVW P = 0.6, beta = 0.009, se = 0.017) (B), vitamin B12 (IVW P = 0.005, beta = −0.17, se = 0.06) (C), and holotranscobalamin (IVW P = 0.01, beta=-0.08, se = 0.004) (D), with genetic liability to ALS. Points indicate effect size (β) and standard errors for each SNP-outcome relationship. (E) Robust MR measures and sensitivity analyses for each MR analysis.
|