FIGURE

Fig. 5

ID
ZDB-FIG-220416-35
Publication
Zarei et al., 2022 - High activity and high functional connectivity are mutually exclusive in resting state zebrafish and human brains
Other Figures
All Figure Page
Back to All Figure Page
Fig. 5

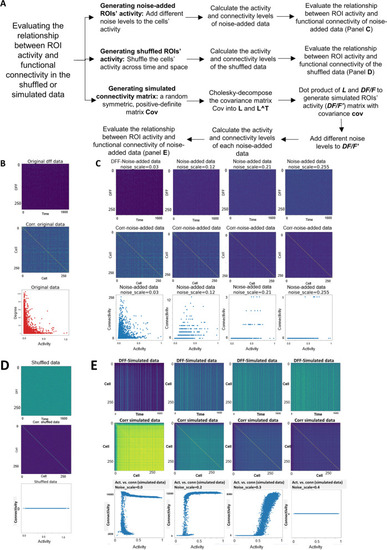
Shuffled, noise-added, and simulated data show activity-connectivity relationship that is distinct from the brain data. A Schematic showing the generation and analysis of noise-added, shuffled, or simulated data. BE Different datasets with neuronal activity time series (top), cell-wise correlation matrix (middle), and the graphed functional connectivity and activity relationship (bottom). B Original data of an example subject. C Different levels of noise were added to the original data, resulting in the loss of the activity-connectivity relationship observed in the original brain data. Note that the Y axis range is different across the panels. D Neuronal activity time series of the original data were shuffled in both space and time. The activity-connectivity relationship observed in the original brain data was lost. E A simulated dataset shows the activity-connectivity relationship that is distinct to the brain data and is also sensitive to the levels of noise. The number of replicates used is 9

Expression Data

Expression Detail
Antibody Labeling
Phenotype Data

Phenotype Detail
Acknowledgments
This image is the copyrighted work of the attributed author or publisher, and ZFIN has permission only to display this image to its users. Additional permissions should be obtained from the applicable author or publisher of the image. Full text @ BMC Biol.