
Figure 2
- ID
- ZDB-FIG-220416-15
- Publication
- Lopez et al., 2022 - Size- and Oxidation-Dependent Toxicity of Graphene Oxide Nanomaterials in Embryonic Zebrafish
- Other Figures
- All Figure Page
- Back to All Figure Page
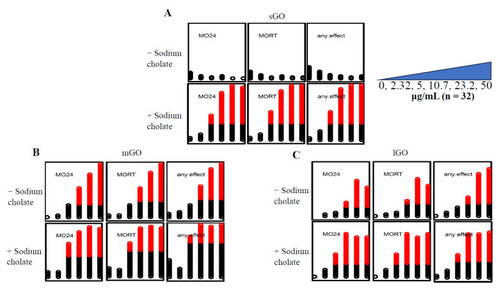
Figure 2. Comparison of GOs with and without sodium cholate. The GO concentration gradient increases from left to right (0 μg/mL, 2.32 μg/mL, 5 μg/mL, 10.7 μg/mL, 23.2 μg/mL, 50 μg/mL), each concentration contained dechorionated embryos (n = 32) exposed for 120 h. MO24 = 24 hpf mortality; MORT = 120 hpf mortality; any.effect = physical malformations, including mortality at 120 hpf. Outcomes significantly above the binomial threshold (Student’s t-test; α = 0.05) are indicated in red on the dot plot. (A) sGO exposures show an increase in mortality upon addition of sodium cholate. (B) mGO exposures show an increase in mortality when sodium cholate was added to the solution. (C) Addition of sodium cholate to lGO (lGOC) had a wider range of mortality compared to lGO (without sodium cholate). |