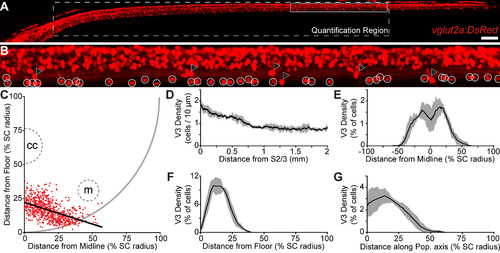
Distribution of V3-IN cell bodies in the spinal cord. A, Maximum intensity projection of a confocal stack of the spinal cord of a 5 dpf Tg(vglut2a:DsRed)nns9 zebrafish larva. The dashed white outline indicates the region of the cord in which cells were quantified. The solid white outline is the region of the image shown at higher magnification in B. B, A higher magnification field of view. White circles indicate V3-INs, black triangles indicate dorsal root ganglion neurons located lateral to the spinal cord. C, Distribution of all quantified V3-INs (red dots) projected in the transverse plane of the spinal cord. The schematic outline of the spinal cord (solid gray line), as well as the location of the central canal (cc) and Mauthner axon (m), are approximate. The heavy black line indicates the line of best fit that best describes the axis of the V3-IN population. D–G, The windowed moving average of V3-IN density along the rostrocaudal axis (D; window width: 250 μm), mediolateral axis (E; window width: 15% SC radius), dorsoventral axis (F; window width: 15% SC radius), and along the population axis (G; window width: 15% SC radius). Black lines are the mean, gray area indicates the SD. SC: spinal cord. Scale bar: 100 μm (A) and 19 μm (B).
|
