|
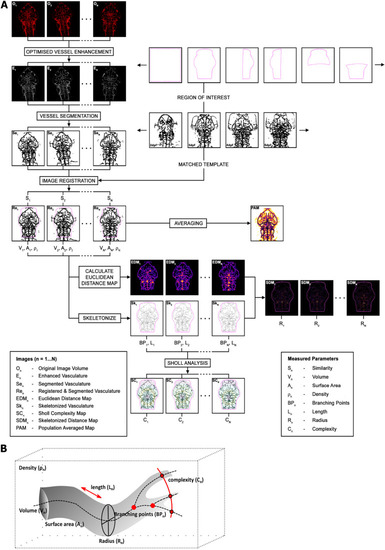
ZVQ workflow overview. (A) Workflow of ZVQ. First, the original images (On) are motion corrected, enhanced (En) and segmented (Sen). Registration to template embryo brings all embryos into one spatial coordinate system (Ren), allowing quantification of similarity (Sn), and is followed by the generation of a population average map (PAM). For examination of specific regions of vascular development, a region of interest (ROI) can be specified. Following ROI extraction, volume (Vn), surface voxel (An) and vascular density (ρn) are quantified. Euclidean distance maps (EDMn) are combined with vascular skeletons (Skn) to quantify radius in skeletonised distance maps (SDMn and Rn), which are also used to quantify network length (Ln), branching points (BPn) and complexity (Cn) via Sholl analysis. (B) Schematic of the vascular parameters extracted by ZVQ.
|