
Figure 3
- ID
- ZDB-FIG-220302-224
- Publication
- Miskolci et al., 2022 - In vivo fluorescence lifetime imaging of macrophage intracellular metabolism during wound responses in zebrafish
- Other Figures
- All Figure Page
- Back to All Figure Page
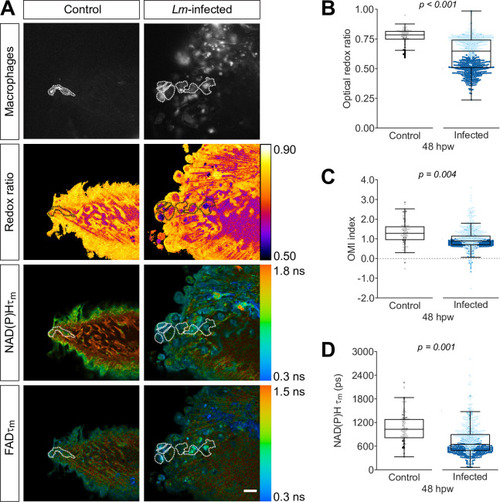
Tail fin transection distal to the notochord was performed using transgenic zebrafish larvae (Tg(mpeg1:mCherry-CAAX) that labels macrophages in the plasma membrane with mCherry) at 3 days post fertilization in the absence or presence of Listeria monocytogenes (Lm). Autofluorescence imaging of NAD(P)H and flavin adenine dinucleotide (FAD) was performed on live larvae at 48 hr post wound (Figure 1A). (A) Representative images of mCherry expression to show macrophages, optical redox ratio, and NAD(P)H and FAD mean lifetimes () are shown for control or infected tail wounds; macrophages were outlined with dashed lines and the area was overlaid in the optical redox ratio and lifetime images to show corresponding area; in the infected condition only a few macrophages are outlined as examples; scale bar = 50 µm. Quantitative analysis of (B) optical redox ratio, (C) Optical Metabolic Imaging index, and (D) NAD(P)H mean lifetime () from three biological repeats (control = 105 cells/16 larvae, infected = 761 cells/14 larvae) is shown; quantitative analysis of associated NAD(P)H and FAD mean () and individual lifetime endpoints (), and sample size for each repeat are included in Figure 3—figure supplement 1. p values represent statistical analysis of the overall effects. Estimated means with 95% CI and overall effects with p values are included in Figure 3—source data 1.
|