
Figure 5
- ID
- ZDB-FIG-220225-17
- Publication
- Paulissen et al., 2022 - Somite morphogenesis is required for axial blood vessel formation during zebrafish embryogenesis
- Other Figures
- All Figure Page
- Back to All Figure Page
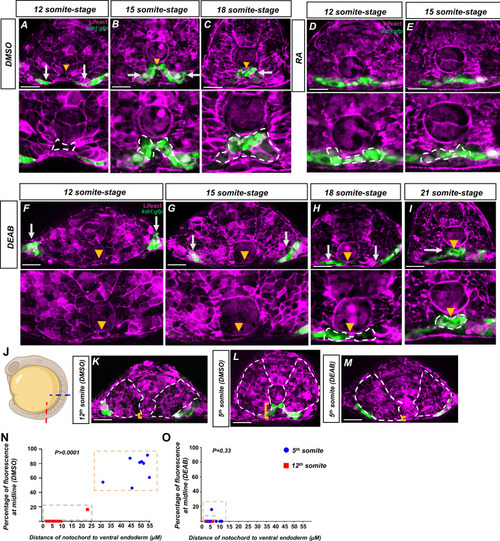
(A–I) Embryos generated by crossing tg(HS:lifeact) to tg(kdrl:eGFP) to label both actin and angioblasts. Yellow arrowheads indicate the midline while white arrows indicate angioblasts. A magnified image includes a white dashed line to indicate notochord-endoderm separation. (A–C) DMSO-treated embryos sectioned at the fifth somite during the (A) 12-somite stage (n = 8), (B) 15-somite stage (N = 8), and (C) 18-somite stage (N = 6). (D, E) 0.1 μM RA-treated embryos sectioned at the fifth somite during the (D) 12-somite stage (N = 8) and (E) 15-somite stage (n = 8). (F–I) 20 μM DEAB-treated embryos sectioned at the fifth somite during the (F) 12-somite stage (N = 7), (G) 15-somite stage (N = 8), (H) 18-somite stage (N = 6), and (I) 21-somite stage (N = 6). (J–L) 15-somite stage embryos generated by crossing tg(HS:lifeact) to tg(Kdrl:eGFP). White dashed lines indicate outline of somites while yellow brackets indicate distance of notochord to ventral endoderm. (J) Schematic showing the sectioned region for experiments in (K–O). Red line indicates sectioning at 5th somite, and the blue line indicates sectioning at the 12th somite. (K) A DMSO embryo sectioned at the 12th somite. Note the lack of midline angioblasts and small distance between the notochord and the ventral endoderm. (L) A DMSO-treated embryo sectioned at the fifth somite. Note the angioblasts at the midline and larger distance from the notochord to the ventral endoderm. (M) A DEAB embryo sectioned at the fifth somite. Note the lack of midline angioblasts and small distance between the notochord and the ventral endoderm. (N) A two-variable graph showing the percentage of angioblast fluorescence at the midline compared to the distance between the notochord and the ventral endoderm. Blue dots indicate DMSO-treated, 15-somite stage embryos sectioned at the 5th somite, and red squares are the same embryos sectioned at the 12th somite (N = 8). (O) A two-variable graph showing the percentage of angioblast fluorescence at the midline compared to the distance between the notochord and the ventral endoderm. Blue dots indicate DEAB-treated, 15-somite stage embryos sectioned at the 5th somite, and red squares are the same embryos sectioned at the 12th somite (N = 8). Scale bars, 50 µm.
|