
Fig. 2
- ID
- ZDB-FIG-220222-18
- Publication
- Binns et al., 2020 - Rational Design of Bioavailable Photosensitizers for Manipulation and Imaging of Biological Systems
- Other Figures
- All Figure Page
- Back to All Figure Page
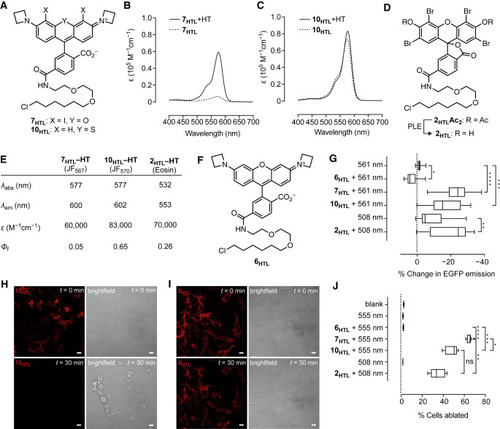
(A) Chemical structures of JF567-HaloTag ligand (7HTL) and JF570-HaloTag ligand (10HTL). (B and C) Absorbance spectra of (B) 7HTL and (C) 10HTL ± HaloTag protein (HT). (D) Chemical structure of eosin-Ac2-HaloTag ligand (2HTLAc2) and conversion to 2HTL by incubation with porcine liver esterase (PLE). (E) Table of photophysical properties for 7HTL, 10HTL, and 2HTL attached to HaloTag protein. (F) Chemical structure of JF549-HaloTag ligand (6HTL). (G) Comparison of EGFP CALI using 561 nm excitation light (laser; 10 W/cm2) alone (n = 19), 561 nm excitation light (laser; 10 W/cm2) with 6HTL (n = 15), 7HTL (n = 23), and 10HTL (n = 14), 508-nm centered excitation light (LED; 10 W/cm2) alone (n = 35), or 508-nm centered excitation light (LED; 10 W/cm2) with 2HTL (n = 30); center line indicates median; box limits indicate upper and lower quartiles; whiskers indicate min-max; data pooled from two experiments and analyzed via Kruskal-Wallis test with Steel-Dwass-Critchlow-Fligner post-hoc test. (H and I) Representative confocal fluorescence (561 nm laser excitation) and bright-field microscopy images of U2OS cells expressing HaloTag-TOMM20 fusion protein incubated with JF570-HaloTag ligand (10HTL) (H) or JF549-HaloTag ligand (6HTL) (I) before (t = 0 min) and after (t = 30 min) wide-field irradiation with 560-nm centered light. Scale bars, 13 μm. (J) Comparison of cell ablation efficacy using 6HTL, 7HTL, and 10HTL with 555 nm excitation light or 2HTL using 508-nm centered excitation light in U2OS cells stably expressing HaloTag-TOMM20 fusion protein exposed to 55 mW/cm2 excitation light for 3 min; center line indicates median; box limits indicate upper and lower quartiles; whiskers indicate min-max; data analyzed via Welch's ANOVA and Games-Howell post-hoc test (n = 5, 10.89 mm2 microplate wells); n = 5 except for blank measurement where n = 10. Statistical significance in (G and J) reported as follows: ∗p < 0.05, ∗∗p < 0.01, ∗∗∗p < 0.001, ∗∗∗∗p < 0.0001. |