
FIGURE 2
- ID
- ZDB-FIG-220209-35
- Publication
- Smeeton et al., 2022 - Regeneration of Jaw Joint Cartilage in Adult Zebrafish
- Other Figures
- All Figure Page
- Back to All Figure Page
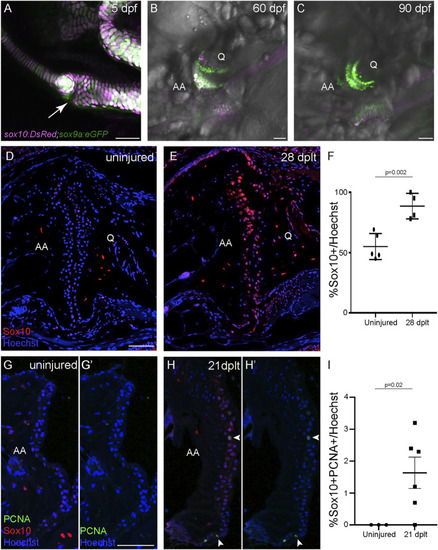
Sox10 expression is upregulated during cartilage regeneration. (A–C) sox10:DsRed and sox9a:eGFP are broadly co-expressed in chondrocytes at 5 days post-fertilization (dpf), and sox10:DsRed becomes restricted to a subset of joint chondrocytes at 60 and 90 dpf. The arrow shows the developing jaw joint at 5 dpf. (D,E) Antibody staining of the adult jaw joint shows endogenous Sox10 protein (red) in joint cells in 1-year-old uninjured control (D) and interopercular–mandibular (IOM)-transected animals at 28 days post-ligament transection (dplt) (E). (F) Quantification of Sox10+ cells as a percentage of total Hoechst+ cells at the jaw joint articular surface. Individual data points, mean, and standard error of the mean are shown. The p-value is calculated by two-tailed Student’s t-test. (G,H) Antibody staining for PCNA (green) and Sox10 (red) of adult jaw joints from uninjured controls (G,G′) and IOM-transected animals at 21 dplt (H,H′). The white arrowheads indicate double-positive PCNA+/Sox10+ nuclei. (I) Quantification of double-positive PCNA+/Sox10+ chondrocyte nuclei as a percentage of total Hoechst-stained nuclei at the jaw joint articular surface. Individual data points, mean, and standard error of the mean are shown. The p-value was calculated using Welch’s two-tailed t-test. AA, anguloarticular bone; Q, quadrate bone. Scale bars = 50 μm. |