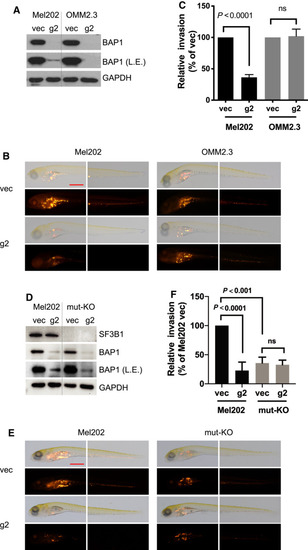
BAP1 deletion suppresses in vivo invasion of SF3B1‐mutated UM cells. (A) Immunoblots show BAP1 KO efficiency by lentivirus CRISPR‐Cas9. The blots shown are representative of three independent experiments. (B) Representative images at 6 days post‐injection (dpi) of vector and CRISPR‐mediated BAP1 KO Mel202/OMM2.3 heterogeneous cell pool engrafted into the yolk sac of zebrafish embryos. The images shown are representative of three independent experiments. The scale bar represents 500 μm. (C) Graphs show quantification of tumor cell invasion. All experiments consist of three independent repeats. For each independent experiment, at least 10 embryos were used in each group. Values of three independent experiments were given as mean ± SD. Student’s t test was used for statistical analysis. (D) Immunoblots show BAP1 KO efficiency by lentivirus CRISPR‐Cas9. The blots shown are representative of three independent experiments. (E) Representative images at 6 dpi of vector and CRISPR‐mediated BAP1 KO Mel202/Mel202 SF3B1 mut‐KO heterogeneous cell pool engrafted into the yolk sac of zebrafish embryos. The images shown are representative of three independent experiments. The scale bar represents 500 μm. (F) Graphs show quantification of tumor cell invasion. All experiments consist of three independent repeats. For each independent experiment, at least 10 embryos were used in each group. Values of three independent experiments were given as mean ± SD. Student’s t test was used for statistical analysis.
|
