
Figure 4
- ID
- ZDB-FIG-220104-112
- Publication
- Dawes et al., 2021 - Cell Fate Decisions in the Neural Crest, from Pigment Cell to Neural Development
- Other Figures
- All Figure Page
- Back to All Figure Page
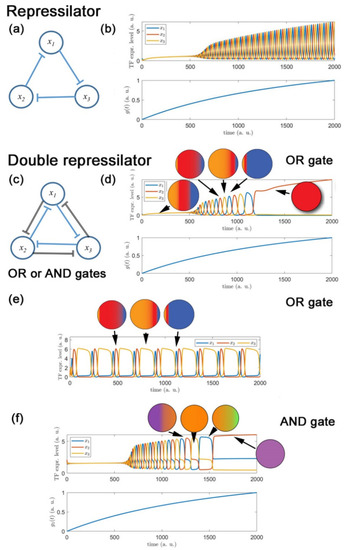
Simple genetic regulatory networks of mutual inhibition and their temporal response to a steadily increasing strength of inhibitory coupling g(t): (a,b) Cyclic repression between three genes (x1–x3) generates oscillatory transcription factor (TF) expression levels as shown by the repressilator circuit; (c,d) Two superimposed sets of mutual inhibition between three genes, with equal inhibitory strengths and using OR gate (i.e., repression occurs so long as one of TFs is expressed), allows for non-oscillatory, multipotent state (panel (d), left), oscillatory expression (giving cells that in a snap-shot view appear fate specified, but which retain multipotency (central region of panel (d), with three distinct biased sub-states depicted diagrammatically) and also for equilibrium states in which one TF is expressed at much higher levels than the other two, i.e., differentiation (panel (d), right). (e) If inhibitory strengths between TFs are asymmetric, this creates oscillation between sub-states, but with temporal bias to one, i.e., biased sub-state favoring specific fate; here (in contrast to the other panels) shown for constant coupling strength, i.e., g(t) = const. (f) Where inhibitions between TFs use AND gate (i.e., both required for the repression), oscillatory sub-states and resultant differentiation states combine expression of 2 TFs, consistent with combinatorial fate determination. |