
Fig. 1
- ID
- ZDB-FIG-211230-54
- Publication
- Huang et al., 2021 - An injury-induced serotonergic neuron subpopulation contributes to axon regrowth and function restoration after spinal cord injury in zebrafish
- Other Figures
- All Figure Page
- Back to All Figure Page
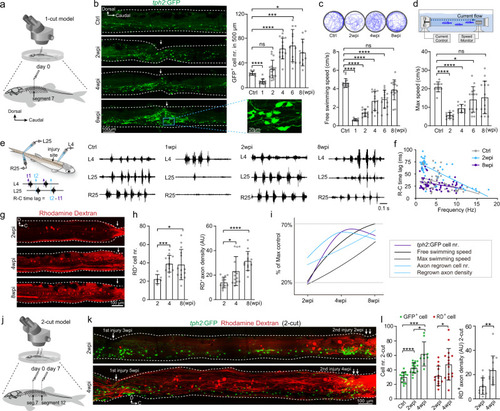
Injury-induced regeneration of intraspinal serotonergic neurons (ISNs) is positively correlated with locomotion recovery.
a Illustration of adult zebrafish one-cut spinal cord injury (SCI) model with a complete transection at the seventh segment. b (left) Immunohistochemistry images show GFP+ ISNs distribution in the lateral view of whole-mount spinal cord in uninjured (Ctrl) and SCI fish. Injury sites are indicated by white arrows. The GFP+ ISNs within the injury site in the blue box is enlarged. (right) Quantification of GFP+ ISNs numbers in the 500 μm long spinal cord covering the injury site. c Five minutes free-swimming traces recorded by camera in the 9 mm open dish, and quantification of free-swimming speed of uninjured and SCI animals. d Illustration of a forced-swimming setup, and quantification of maximum water velocity at which uninjured and SCI fish reached exhaustion. e Illustration of the multi-channel electromyogram (EMG). Typical EMG traces recorded from uninjured and SCI animals for the same duration were shown. f Plots of R–C time lag versus swimming frequency for each swimming cycle in uninjured and SCI animals. N = 4 fish in each group. g Images show rhodamine dextran (RD) retrograde labeling of spinal interneurons with axon regrowing over injury site after SCI. h Quantification of retrogradely labeled spinal interneuron numbers in the 2–4 segments rostral to the injury site and regrown axon density for semispinal thickness laterally. i Correlation analysis shows the relationship of GFP+ ISNs numbers in the injury site, the free and maximum swimming speeds, axon-regrown spinal interneuron numbers, and regrown axon density after SCI. y-Axis represent the percentage of maximum value. j Illustration of adult zebrafish 2-cut SCI model with a second complete transection at the 12th segment. k Immunohistochemistry images show GFP+ ISNs distribution and RD retrograde labeling in two-cut SCI model. l Quantification of GFP+ ISNs numbers at the second injury site, RD+ retrogradely labeled axon-regrown spinal interneuron numbers and regrown axon density rostral to the secondary injury site. All data are presented as mean ± SD. *P < 0.05, **P < 0.01, ***P < 0.001, ****P < 0.0001, significant difference. For detailed statistics, see Supplementary Table 1. |
| Gene: | |
|---|---|
| Fish: | |
| Condition: | |
| Anatomical Term: | |
| Stage: | Adult |