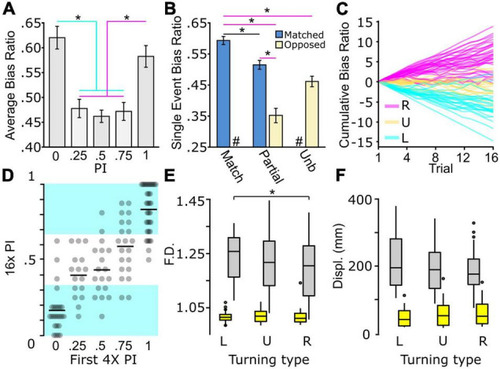
Biased and unbiased motor types present during light-search. (A) Absolute bias ratio from 4× recording per PI (PI 0, N = 66; PI 0.25, N = 74; PI 0.5, N = 75; PI 0.75, N = 75; PI 1, N = 67). (B) Absolute bias ratio magnitude for single 30 s recordings occurring in a direction matching (blue) overall average PI direction or occurring in the opposed (beige) direction shown for perfect bias (0,1 PI, N = 517), partially biased (0.25, 0.75 PI, N = 596), and unbiased (0.5 PI, N = 301) populations. (C) Cumulative summation of bias ratio over the q4× from strong right (magenta, N = 34), strong left (cyan, N = 34), and unbiased (yellow, N = 18) individuals. Individuals were selected based on the first 4× average PI (strong right PI = 1, strong left PI = 0, unbiased PI = 0.5). (D) Average q4× PI based on initial 4× PI (PI = 0, N = 66; PI = 0.25, N = 74; PI = 0.5, N = 75; PI = 0.75, N = 75; PI = 1, N = 67). Black bars represent sample mean. Left, right, and unbiased performance categorized within equal thirds of the PI scale. Cyan background highlights average PI with left or right turning type behavior. (E,F) Characterization of path trajectory features during baseline (yellow boxes) and dark (gray boxes) responses from individuals tested in the q4× assay. Turning type determined by 16× average PI distribution in (D). (E) Fractal dimension and (F) Displacement (L, left, N = 36; U, unbiased, N = 40; R, right, N = 38). Asterisk p < 0.05.
|
