
FIGURE
Fig. 2
- ID
- ZDB-FIG-211224-34
- Publication
- Migdał et al., 2021 - Multi-omics analyses of early liver injury reveals cell-type-specific transcriptional and epigenomic shift
- Other Figures
- All Figure Page
- Back to All Figure Page
Fig. 2
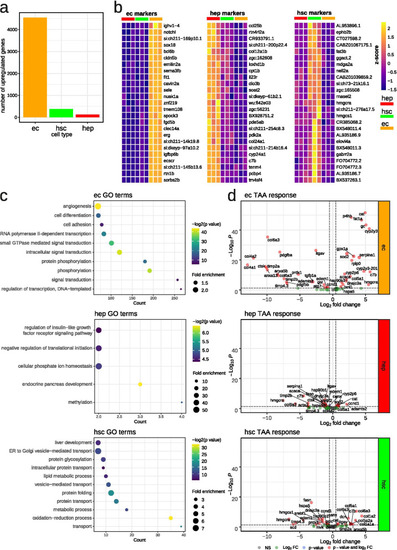
Liver cell signatures in quiescent and activated state. a Number of identified cell type specific genes at quiescent state in each cell type, logFC > 0, padj < 0.05; b Heatmaps of top 25 cell type specific genes at quiescent state in each cell type, logFC > 0, padj < 0.05; c GO over-representation analysis of identified cell type specific genes at quiescent state in each cell type; d Volcano plot of selected genes, involved in liver fibrosis and response to oxidative stress, under TAA treatment |
Expression Data
Expression Detail
Antibody Labeling
Phenotype Data
Phenotype Detail
Acknowledgments
This image is the copyrighted work of the attributed author or publisher, and
ZFIN has permission only to display this image to its users.
Additional permissions should be obtained from the applicable author or publisher of the image.
Full text @ BMC Genomics