
FIGURE
Figure 1
- ID
- ZDB-FIG-211219-30
- Publication
- Brun et al., 2021 - Orphan cytochrome P450 20a1 CRISPR/Cas9 mutants and neurobehavioral phenotypes in zebrafish
- Other Figures
- All Figure Page
- Back to All Figure Page
Figure 1
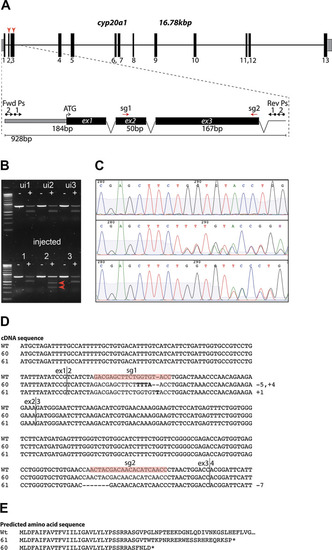
Zebrafish cyp20a1 gene map and allele sequences. (A) Gene models. (B) Gel image showing PCR products and amplicon fragments derived from T7E1 mutant survey (F0). Lower gel shows the positive (heteroduplexed - red arrows) T7E1 signature. (C) Chromatograms from F1 heterozygous embryos (wh60 and wh61) beginning near the sg1 site. (Note the appearance of double peaks). (D) cDNA sequences for exons 1–3 for WT, wh60, wh61. Note wh60 is a 5 bp deletion and 4 bp insertion in exon 2 and wh61 is a 1 bp insertion in exon 2, and a 7 bp deletion in exon 3. (E) Putative translation of cDNAs. |
Expression Data
Expression Detail
Antibody Labeling
Phenotype Data
Phenotype Detail
Acknowledgments
This image is the copyrighted work of the attributed author or publisher, and
ZFIN has permission only to display this image to its users.
Additional permissions should be obtained from the applicable author or publisher of the image.
Full text @ Sci. Rep.