|
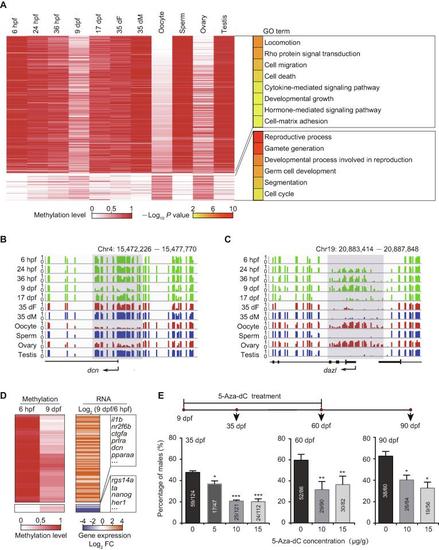
The DNA methylation reprogramming is associated with zebrafish sexual development A. Heatmap of DNA methylation levels for DMPs. These DMPs are classified into groups by PAM method. Corresponding GO terms are shown in the right panel and the color represents the enrichment statistical significance. Promoters are defined as 300 bp upstream and downstream of TSSs for each gene (n = 385). B. Snapshot for DNA methylation at 9 dpf-specific hypomethylated promoter of the gene dcn. Y axis represents DNA methylation level from 0 to 1. Each vertical line represents one CpG site. Dynamic regions around the promoter are highlighted in gray. C. Snapshot for DNA methylation at 9 dpf-specific hypermethylated promoter of the gene dazl. D. Heatmap of DNA methylation level (left) and gene expression FC (right) for genes with DMPs at 6 hpf and 9 dpf. Only genes with |log2 FC| > 1 are included. E. Sex ratio within zebrafish populations at 35 dpf, 60 dpf, and 90 dpf after treatment with 5-Aza-dC at different concentrations. The data are represented by mean ± SEM. Statistical significance was calculated by one-way ANOVA. *, P < 0.05; **, P < 0.01; ***. P < 0.001. DMP, differentially methylated promoter; PAM, Partitioning Around Medoid; TSS, transcriptional start site; GO, Gene ontology; FC, fold change; 5-Aza-dC, 5-Aza-2’-deoxycytidine.
|