
FIGURE
Fig 8
- ID
- ZDB-FIG-211207-20
- Publication
- Albuquerque et al., 2021 - Object detection for automatic cancer cell counting in zebrafish xenografts
- Other Figures
- All Figure Page
- Back to All Figure Page
Fig 8
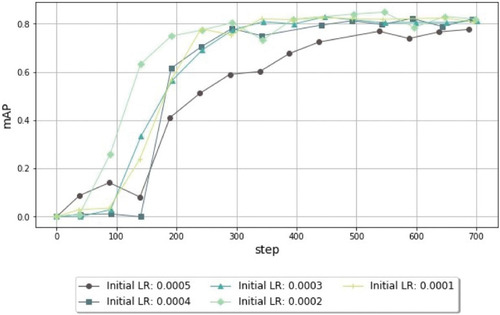
Comparison of mAP values from the object-detection models trained using different initial learning rates (LR) for 700 steps.
After a set of experiments where we test the learning rate with different orders of magnitude, the range of values between 0.0001 and 0.0005 leads to an improvement in the mAP. In this range, the value of 0.0002 results in faster convergence. |
Expression Data
Expression Detail
Antibody Labeling
Phenotype Data
Phenotype Detail
Acknowledgments
This image is the copyrighted work of the attributed author or publisher, and
ZFIN has permission only to display this image to its users.
Additional permissions should be obtained from the applicable author or publisher of the image.
Full text @ PLoS One