
FIGURE 3
- ID
- ZDB-FIG-211201-83
- Publication
- Guo et al., 2021 - Cadherin-12 Regulates Neurite Outgrowth Through the PKA/Rac1/Cdc42 Pathway in Cortical Neurons
- Other Figures
- All Figure Page
- Back to All Figure Page
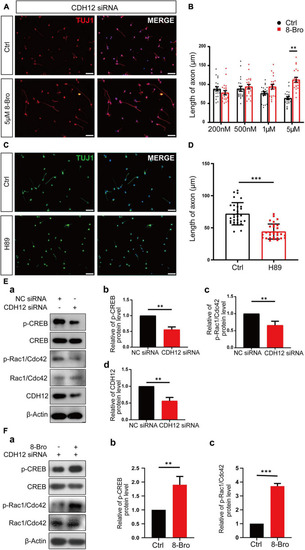
CDH12 regulates neuronal growth via the PKA/Rac1/Cdc42 pathway. (A,B) PKA agonist (8-Bro) could rescue the CDH12 knockdown phenotype when its concentration reached 5 μM. The scale bar represents 75 μm. The statistical data show the mean ± SE. n = 20, ∗∗P < 0.01. (C) Representative images of Tuj1 immunostaining in neurons treated with control (Ctrl) or H89 (3 μM) for 12 h. The scale bar represents 75 μm. (D) The statistical result of axonal length after treatment with the negative control or H89 (3 μM) in E18 neurons. The data shown are the mean ± SE. n = 30, ∗∗∗P < 0.001. (E) CDH12 regulates neuronal growth via the PKA/Rac1/Cdc42 pathway. (a) Representative western blotting results show the levels of p-CREB and p-Rac1/Cdc42 proteins with or without CDH12 knockdown. (b) Statistical result (mean ± SE) of relative p-CREB levels. The value of p-CREB/total CREB in the control treatment was normalized as 1. (c) Statistical result (mean ± SE) of relative p-Rac1/Cdc42 levels. The value of p-Rac1/Cdc42/total Rac1/Cdc42 in the control treatment was normalized as 1. Panel d. Statistical result (mean ± SE) of relative CDH12 levels. The value of CDH12/β-Actin in the control treatment was normalized as 1. n = 3, ∗∗P < 0.01. (F) CDH12 siRNA-mediated inhibition of the Rac1/Cdc42 pathway is rescued by 8-Bro. (a) Representative western blotting results show the levels of p-CREB and p-Rac1/Cdc42 proteins with or without 8-Bro treatment. (b) Statistical results (mean ± SE) of relative p-CREB levels. The value of p-CREB/total CREB in the control treatment was normalized as 1. (c) Statistical results (mean ± SE) of relative p-Rac1/Cdc42 levels. The value of p-Rac1/Cdc42/total Rac1/Cdc42 in the control treatment was normalized as 1. The statistical significance of the difference was determined using ANOVA (∗∗∗P < 0.001, ∗∗P < 0.01 vs. control). |