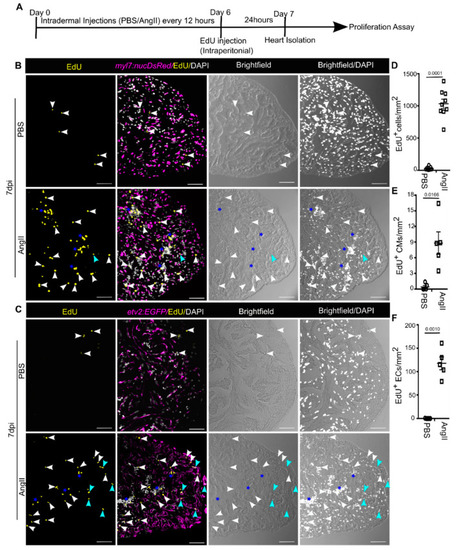
Angiotensin II injection enhances cardiac cell proliferation. (A) Diagram showing the experimental procedure. (B) Representative single plane confocal images of sagittal cryosections of hearts isolated from PBS or AngII injected animals expressing DsRed in CM nuclei (magenta), stained for EdU (yellow: marks proliferating cells), and stained with DAPI (white: marks all nuclei). White and blue arrowheads point to EdU+/DAPI+ cells and EdU+/DAPI+/DsRed+ cells, respectively. Stars indicate cell clusters. (C) Confocal optical sections of sagittal cryosections of hearts isolated from PBS or AngII injected animals expressing EGFP in ECs (magenta), stained for EdU (yellow: marks proliferating cells), and stained with DAPI (white: marks all nuclei). White and blue arrowheads point to EdU+/DAPI+ cells and EdU+/DAPI+/EGFP+ cells, respectively. Stars indicate cell clusters. (D,E) Cardiac cell (n = 9 each) (D) and CM (n = 5 each) (E) proliferation was quantified in cardiac ventricles from PBS or AngII injected animals at 7 dpi. (F) EC proliferation was quantified in cardiac ventricles from PBS or AngII injected animals at 7 dpi (n = 5 each). At least 2 sagittal sections of each heart were analyzed for quantification in (D–F). Error bars indicate the mean ± s.e.m. Dpi: days post-injection. Significant, p < 0.05; non-significant, p ≥ 0.05. Scale: 50 µm.
|
