
FIGURE
Figure 3
- ID
- ZDB-FIG-211201-129
- Publication
- An et al., 2021 - Long noncoding RNAs associated with nonalcoholic fatty liver disease in a high cholesterol diet adult zebrafish model
- Other Figures
- All Figure Page
- Back to All Figure Page
Figure 3
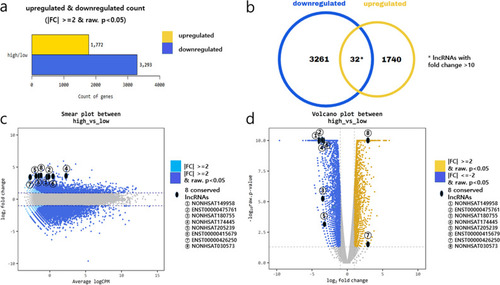
A total of 1772 genes were upregulated and 3293 genes were downregulated with statistical significance |
Expression Data
Expression Detail
Antibody Labeling
Phenotype Data
Phenotype Detail
Acknowledgments
This image is the copyrighted work of the attributed author or publisher, and
ZFIN has permission only to display this image to its users.
Additional permissions should be obtained from the applicable author or publisher of the image.
Full text @ Sci. Rep.