
Fig. 5
- ID
- ZDB-FIG-211122-12
- Publication
- Chen et al., 2021 - In vivo volumetric imaging of calcium and glutamate activity at synapses with high spatiotemporal resolution
- Other Figures
- All Figure Page
- Back to All Figure Page
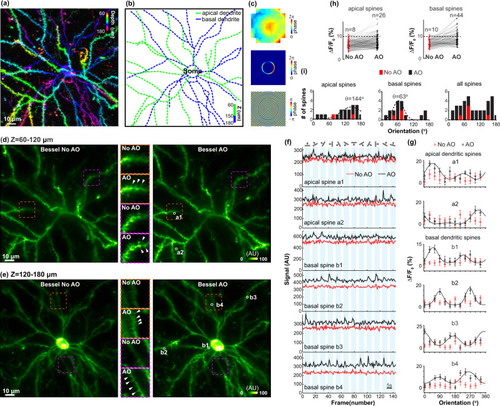
Volumetric imaging of visually evoked glutamate release at apical and basal dendritic spines of a mouse V1 neuron in vivo with AO-corrected Bessel focus.
a Mean intensity projection of the Gaussian imaging stack (128 × 128 × 120 µm3) covering both apical and basal dendritic branches (color-coded by depth). b Apical (green curve) and basal (blue curve) dendritic branches identified from the Gaussian stack. c Wavefront on pupil plane/SLM2 for aberration correction of Gaussian focus, after transmitted through the annular mask, and the computed focal-plane pattern on SLM1 for aberration-corrected Bessel focus. d, e Simultaneously imaged apical and basal dendritic branches of the same volume as in a with Bessel focus before and after AO correction. Insets: zoomed-in views of the structures in dashed boxes. White arrows: spines only resolvable after AO. f Trial-averaged (n = 20 trials) glutamate transients of representative apical and basal dendritic spines (white circles in d and e) evoked by 12 drifting-grating stimuli before and after AO correction and g their corresponding tuning curves averaged across n = 20 trials from a mouse. Shadows (f) and error bars (g): SEM. h Glutamate transient amplitudes (∆F/F0) for 182 apical and 143 basal dendritic spines before and after AO. n: number of spines with ∆F/F0 > 10%. i Preferred orientation distributions of apical, basal, and all dendritic spines measured without (red) and with (black) AO. Dashed curves: Gaussian fits to identify dominant orientations. Post-objective powers: 92 mW for Gaussian and 116 mW for Bessel. Wavelength: 940 nm. AU arbitrary unit. Source data are available as a source data file. |