
FIGURE
Figure 4
Figure 4
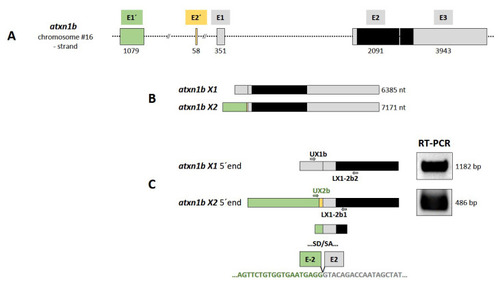
Figure 4. Atxn1b gene in zebrafish. (A) Schematic presentation of the structure of atxn1b gene on chromosome 16 minus strand. The gene consists of five exons (E1′, E2′, E1, E2, and E3) containing the coding sequence (black box) in the last two exons E2 and E3. (B) Two different transcripts (X1 and X2) are predicted in the NCBI database. The atxn1b X1 variant is transcribed from three exons (E1, E2, and E3; grey boxes). The X2 variant contains two alternative exons: E1′ (green box) and E2′ (yellow box) upstream of E1. (C) Experimental verification of predicted atxn1b X1 and X2 variants. Two different primer pairs (UX1b/LX1-2b2 and Ux2b/LX1-2b1) specific for the alternative 5′ exons (shown in A and B) were designed for RT-PCR of zebrafish cDNA templates to amplify the 5′ ends of each variant (left panel). The lengths of the amplicons (right panel) and their sequencing confirmed the predicted atxn1b X1 and X2 (E1′) transcript variants. However, the X2 variant lacks the E2′ sequence (lower panel).
|
Expression Data
Expression Detail
Antibody Labeling
Phenotype Data
Phenotype Detail
Acknowledgments
This image is the copyrighted work of the attributed author or publisher, and
ZFIN has permission only to display this image to its users.
Additional permissions should be obtained from the applicable author or publisher of the image.
Full text @ Int. J. Mol. Sci.