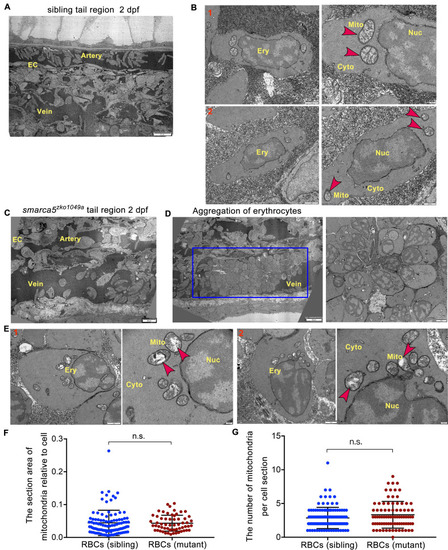
(A) The transmission electron microscopy (TEM) view of a longitudinal section through the artery and vein plexus in sibling tail region at 2 dpf. (B) TEM view of erythrocytes in sibling embryos. The red arrow heads indicate the characteristic pattern of organization in mitochondria. (C) TEM view of a longitudinal section through the artery and vein plexus in smarca5zko1049a tail region at 2 dpf. (D) The blue rectangular box showing blood clots in the caudal vein plexus in smarca5zko1049a. The magnification of blood clots is shown (right). (E) TEM view of erythrocytes in smarca5zko1049a. The red arrow heads indicate the characteristic pattern of organization in mitochondria. The disintegration of cristae in mitochondria is observed in smarca5-deficient RBCs. Ery, erythrocyte; EC, endothelial cell; Mito, mitochondria; Nuc, nucleus; Cyto, cytoplasm. (F) Scatter plots showing the section area of mitochondria relative to cell in RBCs from smarca5zko1049a and their siblings. (G) Scatter plots showing the number of mitochondria per cell section in RBCs from smarca5zko1049a and their siblings. Data are mean ± s.d. (F and G). Asterisk presents statistical significance (n.s. not significant). p Values were calculated by two-tailed unpaired Student’s t-test.