
Fig. 5
- ID
- ZDB-FIG-211118-87
- Publication
- Liu et al., 2021 - NudCL2 is an autophagy receptor that mediates selective autophagic degradation of CP110 at mother centrioles to promote ciliogenesis
- Other Figures
- All Figure Page
- Back to All Figure Page
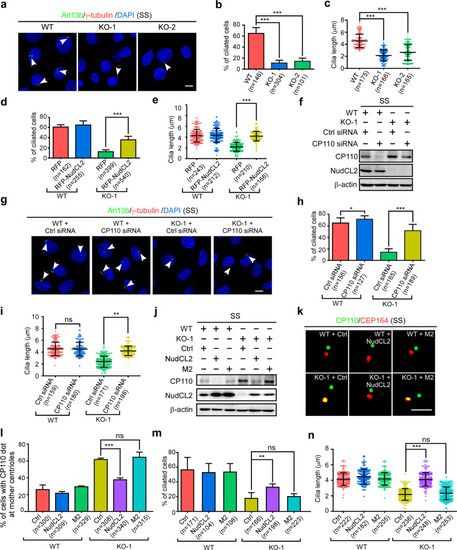
NudCL2 facilitates ciliogenesis by mediating CP110 degradation at mother centrioles.
a–c WT and NudCL2 KO MEF cells were starved for 24 h, and subjected to the following analyses. Immunostaining of cells with anti-Arl13b and anti-γ-tubulin antibodies is shown (a). Scale bar, 10 µm. DNA was visualized using DAPI. The proportion of cells with cilia was calculated (b), and cilia length was measured using ImageJ software (c). d, e WT and NudCL2 KO MEF cells transfected with the indicated plasmids were cultured without serum for 24 h. The ciliated cells were counted (d). Cilia length was determined using ImageJ software (e). f–i WT and NudCL2 KO MEF cells treated with the indicated siRNAs were starved for 24 h, and subjected to the following analyses. Western blotting showed the expression of CP110 and NudCL2 (f). β-actin, a loading control. Immunofluorescence analysis was carried out by using anti-Arl13b and anti-γ-tubulin antibodies (g). Cilia are indicated by white arrows. Scale bar, 10 µm. DNA was stained by DAPI. The ciliated cells were counted (h) and cilia length was measured using ImageJ software (i). j–n WT and NudCL2 KO MEF cells infected with the indicated lentiviruses were cultured without serum for 24 h, and processed for the following analyses. Western blot analysis revealed NudCL2 and CP110 expression (j). Immunofluorescence analyses were carried out with anti-CEP164 and anti-CP110 antibodies (k). Scale bar, 2 µm. The percentage of cells with CP110 dots at mother centrioles was counted (l). The percentage of cells with cilia was calculated (m). Cilia length was also determined using ImageJ software (n). Quantitative data are expressed as the means ± SD (at least three independent experiments). n, sample size. *P < 0.05, **P < 0.01, and ***P < 0.001; ns, not significant (P > 0.05); Student’s t-test. |