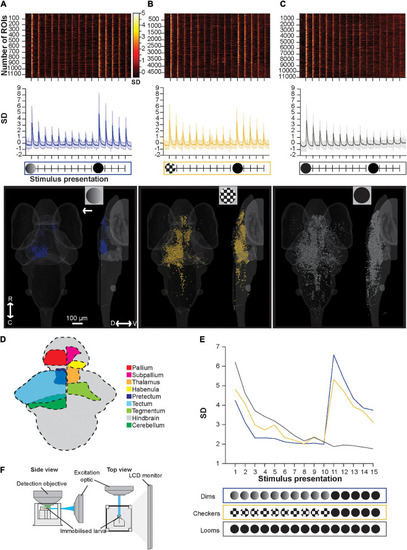
Brain-wide calcium responses to repeated loom, checkerboard, and dim stimuli. (A) A raster plot (top), average trace with S.D. shaded (middle), and transverse and lateral spatial distributions (bottom) of dim sensitive ROIs, arrow represents position of stimulus presentation. (B) Shows the same information for ROIs sensitive to checkerboards, and panel (C) shows this information for ROIs responsive to looms. (D) Schematic representation of key regions’ locations in the larval zebrafish brain. (E) The average maximum brain-wide response of dim, checkerboard, and loom sensitive ROIs and the stimulus trains used during these calcium imaging experiments. Habituation was significant (p = 3.42E-18) for loom sensitive ROIs, checkerboard sensitive ROIs (p = 1.91E-8) and dim sensitive ROIs (p = 2.43E-4, tested with the nparLD R package, using Bonferroni correction for multiple comparisons, adjusting the p-value for significance to 0.01). Responses to the first loom (11th stimulus) were not significantly different from naive loom responses for animals shown checkerboards (p = 0.1513) or dims (p = 0.4491, tested with a Mann–Whitney U test, using Bonferroni correction for multiple comparisons, adjusting the p-value for significance to 0.01). (F) Experimental set up used for calcium imaging experiments, where larval zebrafish are presented the stimulus train on an LED monitor. R, rostral; C, caudal; D, dorsal; V, ventral.
|
