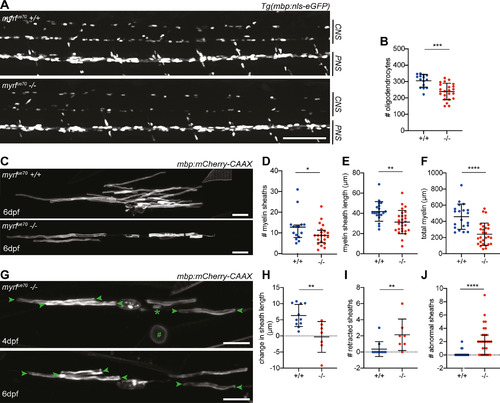
myrfue70 mutants have fewer oligodendrocytes which produce less myelin and fail to maintain myelin sheaths over time. A, Confocal images of the spinal cord at 6 dpf in sibling control and myrfue70 Tg(mbp:nls-eGFP) larvae. Scale bar: 100 µm. B, Oligodendrocyte numbers in the spinal cord at 6 dpf (wild-type: 304.8 ± 39.07, mutants: 239.3 ± 50.48, p = 0.0002, unpaired t test, N = 15 wild types, N = 22 mutants). Error bars represent mean ± SD. C, Representative confocal images of single oligodendrocytes mosaically labeled with mbp:mCherry-CAAX reporter construct in a wild type (top) and mutant (bottom) at 6 dpf. Scale bar: 15 µm. D, Average myelin sheath number was reduced in myrfue70 mutants relative to wild-type siblings at 6 dpf [wild types: 10.50 (7.00–14.00) sheaths per cell, mutants: 7.00 (5.00–10.50) sheaths per cell, p = 0.02, Mann–Whitney test]. Values and error bars represent median and IQR. E, Average myelin sheath length was reduced from 41.83 ±9.68 µm in wild types to 31.35 ±11.49 µm in mutants at 6 dpf (p = 0.002, unpaired t test). Error bars represent mean ± SD. F, Total myelin produced per oligodendrocyte was reduced from 458.2 ± 156.4 µm in wild types to 241.1 ±138.6 µm in mutants at 6 dpf (p ≤ 0.0001, unpaired t test). Error bars represent mean ± SD. D–F, N = 20 wild types, N = 27 mutants. G, Confocal images of a single mutant oligodendrocyte labeled with mbp:mCherry-CAAX at 4 and 6 dpf. A myelin sheath (*) and myelinated neuronal cell body (#) are observed at 4 dpf and subsequently retracted by 6 dpf. Arrowheads label myelin sheaths which are observed to shrink between 4 and 6 dpf. Scale bar: 15 µm. H, Myelin sheaths belonging to wild-type oligodendrocytes demonstrated a net growth of 6.24 ± 3.43 µm between 4 and 6 dpf, while mutants display net shrinkage of myelin sheaths by −0.31 ± 4.79 µm (p = 0.003, unpaired t test). Error bars represent mean ± SD. I, Between 4 and 6 dpf, wild-type oligodendrocytes retracted 0 (0–0) myelin sheaths, while mutants retracted 2 (1–3) myelin sheaths (p = 0.009, Mann–Whitney test). Error bars represent median and IQR. J, Number of abnormal myelin sheaths at 6 dpf [wild types: 0.00 (0.00–0.00); mutants: 2 (0.00–3.00), p ≤ 0.0001, Mann–Whitney test]. Error bars represent median and IQR. H, I, N = 11 wild types, N = 7 mutants. J, N = 20 wild types, N = 27 mutants.
|
