
Figure 1
- ID
- ZDB-FIG-211029-204
- Publication
- Vicente et al., 2021 - Cardioluminescence in Transgenic Zebrafish Larvae: A Calcium Imaging Tool to Study Drug Effects and Pathological Modeling
- Other Figures
- All Figure Page
- Back to All Figure Page
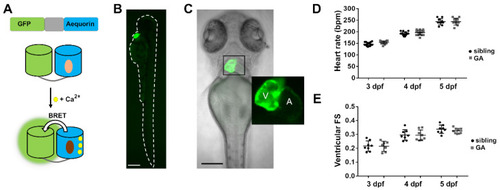
Expression of GA in the heart of zebrafish larvae. (A) DNA construct of the chimera GA and scheme of Ca2+-dependent bioluminescence. BRET, bioluminescence resonance energy transfer. Light and dark brown ovals represent CTZ and its excited state product. (B) GFP fluorescence of a 3 dpf Tg(myl7:GA) zebrafish larva. (C) Superimposed GFP fluorescence and transmitted light images of a 3 dpf Tg(myl7:GA) zebrafish larva. The inset shows the atrium (A) and ventricle (V). (D) HR of GA heterozygous and wild-type siblings at 3, 4, and 5 dpf. Data are shown as mean ± SD (n = 17 for 3 and 4 dpf; n = 10 for 5 dpf). (E) Ventricular fractional shortening (FS), measured with the major diameter, of GA heterozygous and sibling larvae at 3, 4, and 5 dpf. Data are shown as mean ± SD (sibling n = 8 for 3, 4, and 5 dpf; GA n = 7 for 3, n = 8 for 4 dpf and n = 9 for 5 dpf). Statistical analysis was performed using an unpaired t-test in (D) and (E) and no statistical differences were found between GA-expressing and sibling larvae (p > 0.05). The bar scale in (B) and (C) indicates 250 µm and 150 µm, respectively. |