
Fig. 6
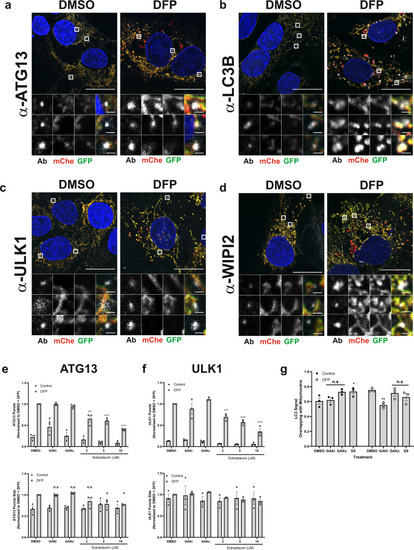
a–d U2OS IMLS cells were treated ± 1 mM DFP for 24 h, fixed and stained for nuclei (DAPI) and the indicated endogenous autophagy markers; a ATG13, b LC3B, c ULK1 or d WIPI2. Representative ×63 images of cells taken by Zeiss LSM710 are shown, scale bar = 10 µm. e, f U2OS cells were treated ± 1 mM DFP for 24 h together with GAKi (10 µM), GAKc (10 µM) or sotrastaurin (2–10 µM), then fixed in PFA before staining for nuclei (DAPI) and the indicated endogenous early autophagy markers; e ATG13, f ULK1. The number and size of puncta formed for each marker were analysed and values obtained were normalised to the DMSO + DFP control. Mean values were plotted from n = 3 independent experiments ± SEM. Significance was determined by two-way ANOVA and Dunnett’s multiple comparisons test to the DMSO + DFP control sample. g U2OS cells were treated ±1 mM DFP for 24 h with GAKi (10 µM), GAKc (10 µM) or sotrastaurin (10 µM) and labelled for mitochondria with MitoTracker red. Co-localisation of LC3 signal with mitochondria was determined by Mander’s co-localisation. Significance was determined by two-way ANOVA and Dunnett’s post-test to the DMSO sample. Where indicated *P < 0.05, **P < 0.01, ***P < 0.001, ****P < 0.0001, n.s. = not significant and #P < 0.05 (to the DMSO control). For precise P values, see the source data file. |