
Fig. 2
- ID
- ZDB-FIG-211025-15
- Publication
- Silva et al., 2021 - In situ and transcriptomic identification of microglia in synapse-rich regions of the developing zebrafish brain
- Other Figures
- All Figure Page
- Back to All Figure Page
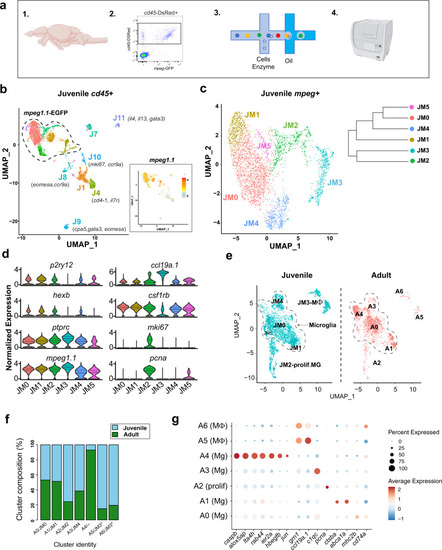
a Schematic diagram of the whole-brain scRNA-sequencing pipeline (items 1 and 4 adapted from BioRender.com (2020). Retrieved from https://app.biorender.com/biorender-templates. b Unsupervised clustering of 6666 juvenile ptprc (cd45)+ cells, colored by cluster. Inset: feature plot of mpeg1.1 expression. n = 10 fish in two independent replicates. Color-coding for inset: normalized mpeg1.1 expression; low expression, gray; high expression, orange. c Subclustering of 3539 mpeg1.1+ cells in c, colored by cluster. Inset: cluster dendrogram. d Violin plots for select marker genes across juvenile clusters from c (JM1-5), including microglia (p2ry12, hexb, and csf1rb), pan-myeloid (mpeg1.1), pan-hematopoietic (ptprc/cd45), macrophage (ccl19a.1) and proliferative (mki67 and pcna). Colors correspond with clusters shown in Fig. 2c. (Solid black line = median; dotted lines = 1st and 3rd quartiles; any lines not visible fall at 0). e UMAP plots showing co-clustering analysis of juvenile cells in c (blue) and 2080 adult (red) myeloid (mpeg1.1+) cells. Data sets were merged then integrated with the Harmony R package before clustering. Conserved macrophage and proliferative clusters indicated. The dotted line outlines the remaining “homeostatic” microglial clusters. f Percent of each cluster shown in e consisting of Juvenile (blue) vs. Adult (green) derived cells. Normalized within groups to account for overall cell number difference between ages. Asterisks indicate a shared juvenile cluster. g Dot plot highlighting select up- and downregulated genes within the combined juvenile and adult clustering in e. Size represents the percent of cells expressing each gene while the color represents normalized and scaled gene expression compared with all clusters; decreased expression: blue, expression unchanged: white, increased expression: red (MAST DE algorithm in Seurat, p < 0.01). See also Fig. S2 and Fig. S3; Supplementary Data S1–S3. |