
Fig. 1
- ID
- ZDB-FIG-211019-1
- Publication
- Koun et al., 2021 - Development of an experimental model for ocular toxicity screening in Zebrafish
- Other Figures
- All Figure Page
- Back to All Figure Page
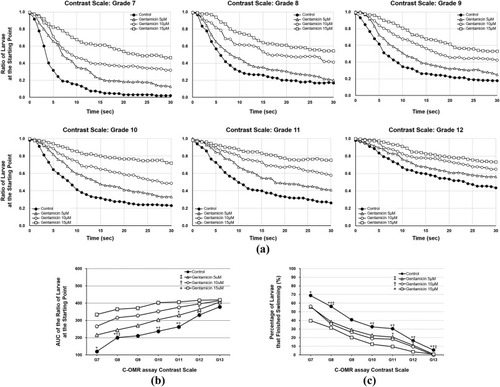
The ratio of larvae at the starting point curve (A), the area under the curve (AUC) of the ratio of larvae at the starting point curve (B), and the percentage of larvae that finished swimming (C) according to the contrast-optomotor response assay after 24 h exposure at 4 dpf to 0 (control), 5, 10, and 15 μM gentamicin. An asterisk (∗) indicates a p-value < 0.05 as compared with the Gentamicin 15 μM group, a dagger (†) indicates a p-value < 0.05 as compared with the Gentamicin 10 μM group, and a double dagger (‡) indicates a p-value < 0.05 as compared with the Gentamicin 5 μM group by one-way ANOVA with post-hoc Tukey HSD test. |