
FIGURE
FIGURE 4
- ID
- ZDB-FIG-211018-74
- Publication
- Yu et al., 2021 - SOCS3 is Related to Cell Proliferation in Neuronal Tissue: An Integrated Analysis of Bioinformatics and Experiments
- Other Figures
- All Figure Page
- Back to All Figure Page
FIGURE 4
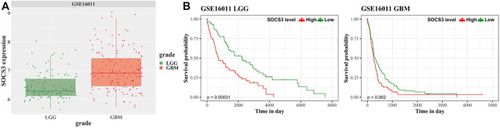
Univariate survival analysis in GBM and LGG stratified by SOCS3 expression based on the GSE16011 dataset for validation. |
Expression Data
Expression Detail
Antibody Labeling
Phenotype Data
Phenotype Detail
Acknowledgments
This image is the copyrighted work of the attributed author or publisher, and
ZFIN has permission only to display this image to its users.
Additional permissions should be obtained from the applicable author or publisher of the image.
Full text @ Front Genet