
Fig. 4
- ID
- ZDB-FIG-211018-30
- Publication
- Gross et al., 2021 - Notch regulates vascular collagen IV basement membrane through modulation of lysyl hydroxylase 3 trafficking
- Other Figures
- All Figure Page
- Back to All Figure Page
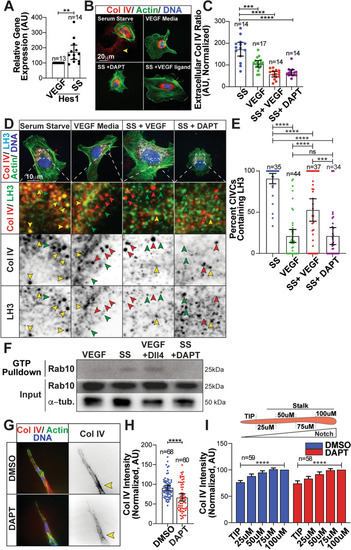
Notch signaling regulates LH3 trafficking. (a) Graph of relative hes1 gene expression in ECs cultured in VEGF-containing or serum-starve (SS) media. Gene expression levels normalized to GAPDH. N number of replicates. (b) Representative images of ECs cultured in VEGF-containing, SS media, SS media + VEGF ligand (100 ng/µL), or SS media + DAPT (10 µmol/L) and stained for Collagen IV (Col IV) (red), actin (green), and DNA (blue). Arrowhead denotes extracellular Col IV secretion. (c) Graph of Col IV extracellular ratio of ECs across indicated groups. (d) Representative images of ECs cultured in indicated groups and stained for Col IV (red), LH3 (light blue), actin (green), and DNA (blue). Yellow arrowheads indicate co-localized puncta only, red arrowheads indicate Col IV only puncta, and green arrowheads indicate LH3 puncta only. (e) Graph of percent CIVC vesicles co-localized with LH3 in indicated conditions. (f) Immunoprecipitation blot for active (GTP-bound) Rab10 in the presence of VEGF-supplemented or SS media, VEGF media on a Dll4-coated plate, and SS media containing DAPT. (g) Representative image of fibrin-bead sprout stained for Col IV (red), actin (green) and DNA (blue). Arrowheads denote Col IV accumulation. (h) Graph of Col IV intensity between indicated groups. N number of sprouts. (i) Top- schematic of Col IV measurements taken on sprouts. Graph of Col IV intensity starting at the vascular front and measured back every 50 µm between indicated groups. Intensities are normalized to Col IV levels at 100 μm for each group. For all graphs n number of cells unless otherwise indicated. For all experiments, data represented as mean ± 95% confidence intervals. Black bars indicate comparison groups with indicated p-values. All p-values are from two-tailed Student’s t-test from at least three experiments. *p ≤ 0.05; **p ≤ 0.01; ***p ≤ 0.001; ****p ≤ 0.0001; ns not significant |