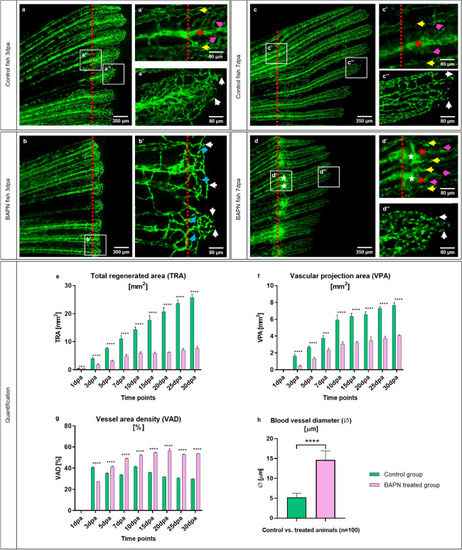
In vivo effects of the collagen cross-linking inhibitor, BAPN, on caudal fin regeneration and neoangiogenesis. Vascular alteration during normal fin regeneration (a, c) versus BAPN-treated group (b, d) at 3dpa and 7dpa is documented (green - reporter transgenic zebrafish line). Vessels in the regenerating region of the controls (a, a’ and c, c’, red dotted lines indicate the amputation) appear hierarchically well organized, building a vascular tree with arteries (red arrow), veins (yellow arrows) and connecting capillaries (purple arrows). Capillaries at the vascular front are representing multiple sprouts (a’’, c’’, white arrows). Shorter regeneration area and respectively modest vascularization in BAPN-treated animals (b); hierarchical organization in supplying and draining vessels as well as capillaries is less pronounced. Many capillary connections are very thin and not perfused (b’, blue arrows); multiple sprouts are visible at the vascular front (b’, white arrows). At 7dpa the regenerating region, respectively the vascular plexus is smaller in comparison to the controls. Balloon-like enlarged blood vessels (detectible as a green sphere) are visible at the site of amputation (d, d’, asterisks). Those angioma-like structures are connected to the arteries (d’, red arrow) and in some cases to the veins (d’, yellow arrows). Further distal tiny connecting capillaries are indicated by purple arrows (d’): vessel network is disorganized and contains higher number of ECs as indicated by the dense nuclear appearance. Images are acquired with a fluorescent reflected light microscope. Quantification of tissue regeneration and vascularization after inhibition was assessed by three variables: Total regenerated area (TRA = regenerated fin in mm2; e), vascular projection area (VPA = vessels within regenerated part in mm2; f) and vessel area density (VAD = vessels density within the regenerated part in %; g) during a period of 30 days in control group (green) versus BAPN-treated group (purple). n = 5. h) Quantification of lumen dimensions (in μm) between control and BAPN-treated animals. Blood vessel diameter in BAPN-treated animals increases by 70%; n = 100.
|
