
Fig. 7
- ID
- ZDB-FIG-210930-7
- Publication
- Osborn et al., 2020 - Fgf-driven Tbx protein activities directly induce myf5 and myod to initiate zebrafish myogenesis
- Other Figures
- All Figure Page
- Back to All Figure Page
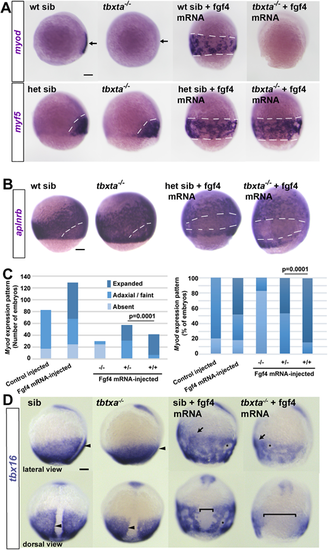
Embryos from a tbxta+/− incross injected with 150 pg fgf4 mRNA or control. (A) Tbtxa−/− mutants lack myod mRNA (arrows) but retain myf5 mRNA in presomitic mesoderm (white dashes). Fgf4 induced myf5 and myod mRNAs throughout the posterior mesoderm in siblings (sib; white dashes), but failed to induce myod mRNA in mutants. (B) Fgf4 suppressed aplnrb mRNA in posterior mesoderm above the germ ring (white dashes) in both tbxta−/− mutants and siblings. In A,B, individually genotyped embryos are shown in lateral view, dorsal to right. (C) Scoring of myod mRNA accumulation in response to Fgf4 in a tbxta+/− incross. Expanded: ventral expansion, generally all around germ ring as in A. Adaxial/faint: either wild-type pattern, or reduced intensity in a small proportion of mutants that was not significantly altered by Fgf4. Left: absolute number of embryos analysed from two experiments to emphasise the lack of induction in mutants (see Table S3). Right: alternative display to highlight the reduced response in heterozygotes compared with wild type (χ2 test). (D) Adaxial upregulation of tbx16 mRNA is lost in tbxta−/− mutants (arrowheads). Fgf4 upregulates tbx16 mRNA throughout ventral posterior mesoderm (arrows) and causes mesodermal cell aggregation (asterisks). tbxta−/− mutants accumulate less tbx16 mRNA than siblings and have less expression on the dorsal side (brackets). Scale bars: 100 µm. |