
Figure 5
- ID
- ZDB-FIG-210909-16
- Publication
- Templehof et al., 2021 - Zebrafish mutants provide insights into Apolipoprotein B functions during embryonic development and pathological conditions
- Other Figures
- All Figure Page
- Back to All Figure Page
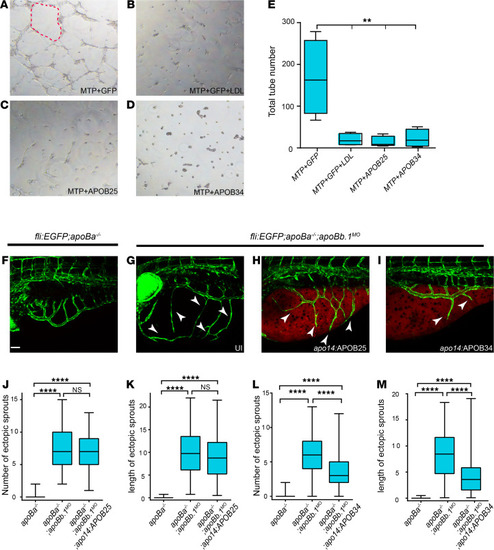
(A–D) Tube formation assay on HUVECs untreated (A, C, and D) or treated with LDL (B) plus conditioned medium from HEK293 cells cotransfected with (A and B) MTP+GFP, (C) MTP+APOB25, and (D) MTP+APOB34. Red dashed line outlines vascular tube structure. (E) Quantification of total number of tubes following different treatments (n = 3, nMTP+GFP = 4, nMTP+GFP+LDL = 4, nMTP+APOB25 = 5, nMTP+APOB34 = 4). The data are shown as the mean ± SEM, calculated using ANOVA followed by Tukey’s multiple-comparison test. **P < 0.01. (F–I) Confocal images at 4 dpf showing reduction in the number and length of ectopic sprouts in Tg(fli1:EGFP) apoBa–/– apoBb.1MO embryos injected with apo14:APOB34 (I) as compared with uninjected apoBa–/– (F), uninjected apoBa–/– apoBb.1MO (G), and apoBa–/– apoBb.1MO injected with apo14:APOB25 (H). White arrowheads point to ectopic sprouts. (J–M) Quantification of the number and length of ectopic sprouts in apo14 APOB25 (J and K) (n = 3, napoBa–/– = 47, napoBa–/– apoBb.1MO = 54, napoBa–/– apoBb.1MO apo14:APOB34 = 54) and apo14 APOB34 (L and M) (n = 3, napoBa–/– = 47, napoBa–/– apoBb.1MO = 51, napoBa–/– apoBb.1MO apo14:APOB34 = 55) injected embryos. The data are shown as the mean ± SEM, calculated using ANOVA followed by Tukey’s multiple-comparison test. Scale bar (F–I): 50 μm. ****P < 0.0001. P < 0.05 (considered significant versus control group). |